In this series we will show you under the hood of the machine learning pipelines that power Einstein Behavior Score, a key feature of Pardot Einstein that helps marketers understand when prospects are ready to buy. We will describe our modeling approaches and share our journey on interpretable models to earn the trust of our customers by providing actionable insights with our predictions. Additionally, we will also describe how we generate scores and insights for all customers through a model tournament, so that enterprises and small businesses alike can benefit from our machine learning products. Finally, we will give you a glimpse into the architecture that powers these predictions for our customers and our monitoring pipelines to ensure our models are performant in production.
The Sales and Marketing Funnel
Sales and marketing teams often have too many leads to pursue with limited time and budget at their disposal. To build a strong sales pipeline, marketers should target their prospects with the right content to engage their interests and nurture them before handing them off for their sales teams to pursue. Effective strategies for scoring leads and opportunities help sales teams prioritizing the right prospects and accurately forecasting opportunities help them identify issues early on to correct course and meet their targets when there is a shortfall.

Features in the Pardot Einstein and Sales Cloud Einstein family of products help Salesforce customers build and nurture effective sales and marketing funnels, with the former focused on marketing teams and latter focused on sales teams.

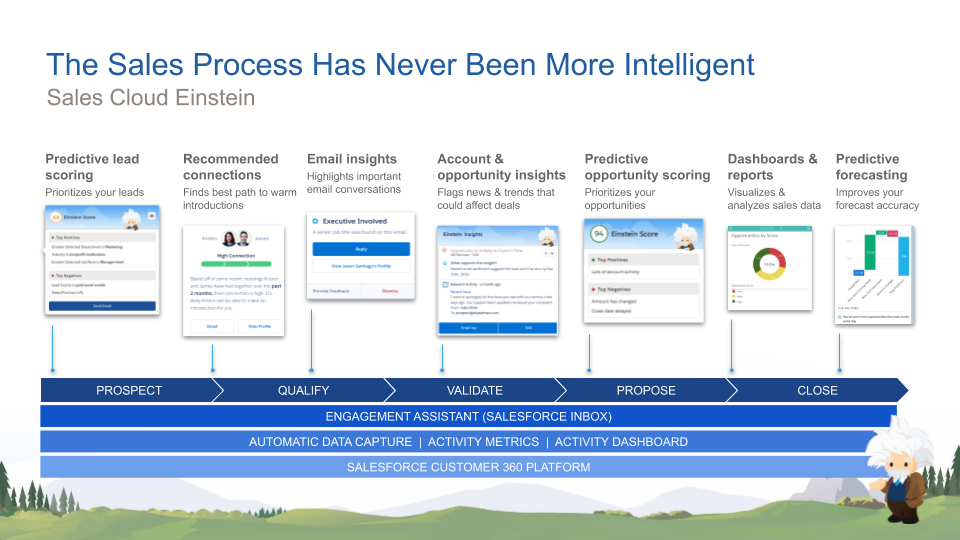
In the sections below we will focus on how we built Einstein Behavior score and less on the features and functionality of this component of Pardot Einstein. If you are interested in learning more about the various features in either of those products or how to leverage them for your business, we encourage you to check out the Einstein Basics for Pardot or Sales Cloud Einstein trails on Trailhead.
Einstein Behavior Scoring: Overview
The concept of scoring leads or prospects based on attributes such as their engagement patterns, firmographics, and demographics is a foundational component of any marketing or sales process. Rules-based models are often used to control the distribution of points, scores or grades that are assigned to each lead or prospect; however, this process is often described as a bit of a guessing game with little confidence in the end result. If you think about the amount of lead or prospect engagement data your organization generates every month between your marketing automation tool and your CRM solution, the problem of accurately scoring your prospects based on engagement patterns is a perfect fit for machine learning. Move on from the guessing game of outdated rules-based scoring and discover the true engagement patterns that drive opportunities for your business, all with the flip of a switch!
Einstein Behavior Scoring (EBS) uses machine learning to identify the unique engagement patterns your prospects take that signal their likelihood of driving an opportunity for your sales team. To do this, Einstein looks at which behaviors (form submissions, video views, email opens, etc.) are the prospects who become sales qualified, or drive the creation of an opportunity, taking in their journey of engaging with your marketing content. Not only does Einstein learn which types of actions are most, or least, significant in driving an opportunity, but he also learns the significance of engaging with specific marketing assets and the timing, or recency, of each engagement.
Our journey in modeling Einstein Behavior Scoring
Pardot customers have had access to a Prospect Score and Grade long before we introduced Einstein. This rule based score allowed marketers to build workflows that would automatically assign points to prospects based on the kind of activities they engaged in. This score was unbounded, so it grew over time. With this system a marketer could not differentiate between a prospect that has shown a lot of recent engagement compared to an inactive prospect who was active many months ago as they’d both have similar prospect scores. We launched Einstein Behavior Score as part of Pardot Einstein in Spring 2019 using an unsupervised model powering scores and insights. The weights of activities were based on expert encoded rules which were time decayed so that more recent activities received higher weights. Our goal then was to roll-out this powerful feature for Pardot customers such that any customer, no matter their size or length of historical data could harness it. More recently we’ve introduced two improvements to Einstein Behavior Score using supervised models.

We’ll next describe each of these approaches below, the challenges we faced and the improvements we made in our next generation models.
The Unsupervised Model
The unsupervised model for a behavior score is generated for active prospects based on their activities in the last year. There are two broad categories of features: rate based features such as email open rate and email click rate and count based features that capture the frequency of each activity type and type name combinations found in each organization. For every feature, a different weight and time decay parameter is assigned based on subject matter expertise.
For example, clicking on an email or submitting a form signifies more proactive engagement than merely opening an email, so the former two events are assigned a higher weight compared to the latter. Additionally recent activities are assigned higher weights than activities in the distant past. For instance, an email click event today could have the same impact as five different email clicks nine months ago. Combining different time decay parameters and custom weights allow higher flexibility in modeling real-life scenarios. Activities can have an immediate impact on the score, but their effect vanishes over time.
The dot product of the feature values and weights for each prospect is then normalized to range from 0 to 100. Having the scores in a predefined range helps preserve the meaning of different score buckets, so that marketers could use the Engagement Studio to create and diversify their campaign strategies based on engagement levels. A score closer to 100 signifies the highest level or engagement and that closer to 0 signifies the lowest.
In addition to displaying the score for each prospect, we also surface the features that positively and negatively influenced the score as a percentile rank of the features’ value across the population of all scored prospects.
Challenges
While this simple unsupervised model is more powerful than a rule based assignment of behavior scores to prospects, it has several obvious challenges:
- Incorporating additional features is cumbersome: The weights associated with the activities were encoded based on inputs from subject matter experts. Over time, customers may introduce new assets that their prospects may interact with which could help improve their engagement. For instance, if the prospect comes from an organization our customers have previously done business with (example: prospect with email ID john.doe@initech.com), then the likelihood of that prospect’s conversion is probably more than a firm they’ve previously had not done business with. Incorporating these additional signals is cumbersome.
- Limited means of validating the behavior scores: unsupervised model relies on qualitative feedback to assess the effectiveness of the generated scores. Tweaking the weights of the one or more activities would require us to re-validate the whole pipeline. Over time, as the nature of a customer’s business changes, some activities might be considered more important than others, making it harder to ensure if the generated scores are still meaningful.
- Incorporating user feedback is difficult: With an unsupervised model, the only way for us to incorporate any feedback that our customers might provide us regarding the quality of our scores is to manually adjust the weights and the normalization/calibration approach that generate the final scores.
- Ability to clearly explain the scores is limited: Providing global insights into key factors contributing to the behavior score as well as local insights for a specific prospect is limiting. Comparing a prospect’s value for a certain activity type against the rest of the population puts the burden on the user to make a judgement on whether they should continue to nurture the prospect or pursue other prospects. Furthermore, this makes an assumption that the relationship between the activities and the behavior score of the prospect is linear, that there are no interactions amongst the various activity types. This is again left to the user to infer based on their expertise.
If we were to wave a magic wand and build a powerful, supervised model for Behavior Scoring, we could address many of the limitations and scale this system to tens of thousands of customers. Since with a supervised model we machine learn the weights, incorporating additional attributes is just a matter of stitching the right dataset together. By defining and agreeing on a target variable we’re trying to predict, we can easily validate the performance of our model against that outcome and monitor it over time, across all orgs, using standard model metrics such as AUC, Precision, Recall and F1 Scores. User feedback can be captured by populating the target variable with better quality data. The scores can be explained using global models like feature importance measures or partial dependence plots (PDP) and local models like SHAPley Additive Explanations (SHAP) that can account for complex features interactions captured by non-linear models. In the next section we’ll describe just that.
The Supervised Model
In order to build a supervised model for EBS, it is important for us to understand the lifecycle of a prospect in Pardot to be able to define the outcomes we are interested in modeling. The illustration below summarizes the lifecycle of a prospect in Pardot. When a visitor to a website provides an email address we could track them against, they become a prospect. The prospect could then be linked to a CRM lead, in which case they could eventually convert into a contact. Alternatively, the prospect could directly be linked to a contact in CRM, skipping the Lead creation step. From this point on, the Contact may eventually be linked to an opportunity via an Opportunity Contact Role (OCR), completing its conversion. For prospects which were directly linked to a contact and did not get linked to an Opportunity via OCR, we may continue to track if they are engaged (ex: do they show continued activity in the next week?). There could be some prospects in Pardot that were qualified into a Marketing Qualified Lead (MQL) and then a Sales Qualified Lead (SQL) before being linked to a CRM lead or contact. This process of qualification gives us a weak proxy in determining what is a promising prospect and what’s not. Lastly, there may be prospects in Pardot which are inactive for a long time and have thus not been qualified to link them with a CRM lead or contact. In all these paths that a prospect may take in its lifecycle, it may at eventually end up not converting into an opportunity or might just disengage; we assume that these prospects will not convert, hence are not good candidates to be nurtured.

Censored Data
As we described above, a prospect goes through many different stages in its lifecycle before linking to an opportunity. Shown below are two sample funnels. As one can see, only a fraction of prospects become a Marketing Qualified Lead (MQL), even fewer become a Sales Qualified Lead (SQL), and far fewer opportunities are eventually won. The challenge, in addition to such low conversion ratios, is that a marketer cannot determine when a prospect will move to the next stage of the funnel or if it at all they will. Some prospects might move quickly from one stage of the funnel to the next, while many others may take a long time. Thus, we encounter the problem of ‘right censoring’ in defining our outcome, i.e. if a prospect has not linked to an opportunity yet, we do not necessarily know that it never will.

Here are two examples of the Kaplan-Meier plot of the probability of non-conversion of prospects since their creation date.
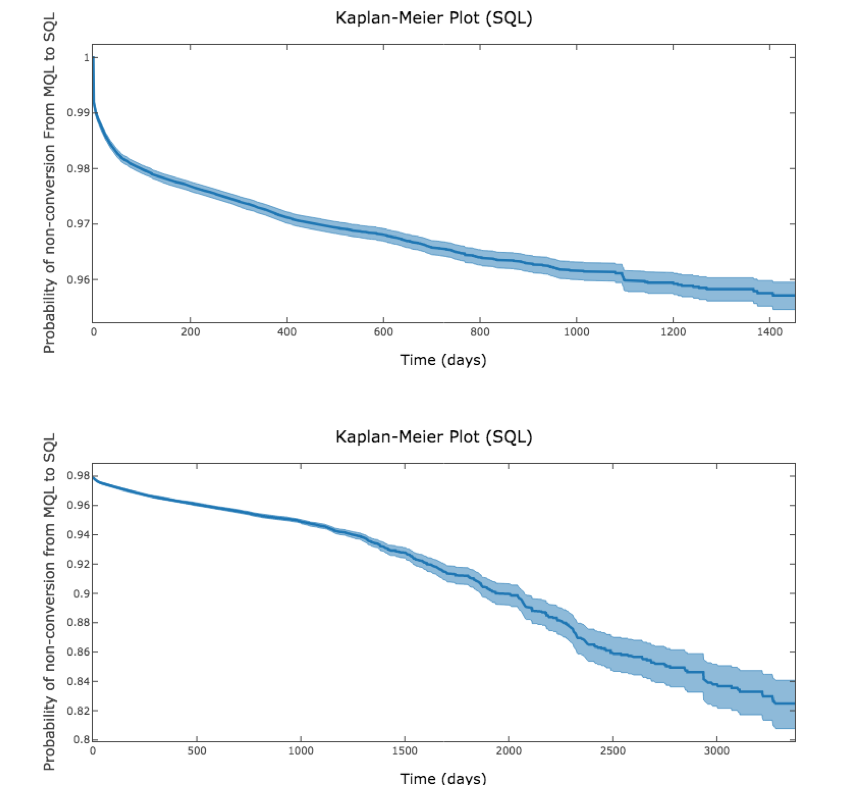
We can make two quick observations: firstly, that different organizations have sales cycles of different durations and secondly, that a vast majority of prospects that do convert do so within a certain time period. We define this time period to be the ‘forecast horizon’ and consider those prospects which have not linked to an opportunity in this time frame as negative samples.
In essence, this problem is akin to predicting customer churn. There are many ways to go about modeling this, whether it is through the user of a sequence model, a ranking model or plain old binary classification. For convenience and flexibility, we decided to model this as a traditional classification problem so that we could apply a wealth of tools to measure, monitor and debug our models in production. Interested readers should checkout Egil Martinsson’s blog post on WTTE-RNN, for a more in-depth treatment of the various modeling techniques for problems of this nature.
Forecast Horizon
As we described above, we define a threshold for the conversion time of a prospect, called its forecast horizon, and apply this threshold to address the problem of right censored data. We compute the forecast horizon as the time in days taken for 90 percent of prospects to convert, amongst all the prospects that converted. We further floor this down to the nearest of 30, 90, 180, and 365 days for every organization. If we encounter a prospect that has been in the system for less than forecast horizon amount of time, then we cannot determine its outcome. In this case, we ignore this prospect in our training dataset. If the prospect has been in the system for longer than forecast horizon amount of time, then we assume that this prospect will not convert and label it as a negative sample. The predictions from our models thus signify if a prospect will link to an opportunity within forecast horizon amount of time.
Modeling Datasets
We use a variety of signals from Pardot as well as from CRM in building EBS. For the supervised model to work well, we expect at least six months of prospect engagement history with a minimum of 20 connected prospects that have linked to an opportunity in this time period.

Each prospect’s activity count feature vector are time-binned, i.e. they reflect the number of activities the prospect engaged in the last day, week, month and year. Additionally, we snapshot this activity count feature vector for every month the prospect remained unconverted. For instance, let’s say prospect P_0123 was created on Jan-12, 2018 and it linked to an opportunity on Dec-14, 2018. Let’s also assume the forecast horizon as we previously described, for this organization is 6-months, then the snapshotted records for this prospect in the training dataset will look like the following:
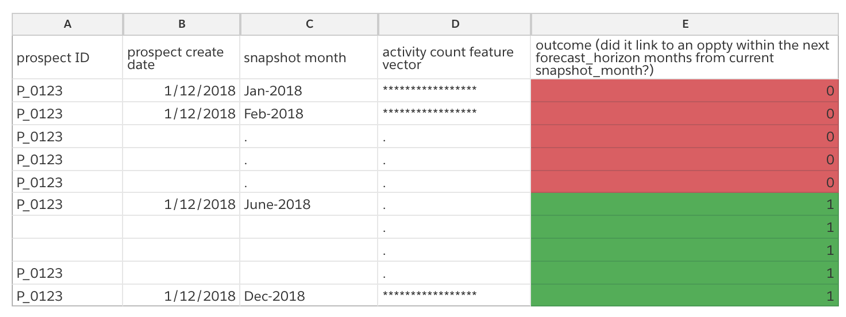
The modeling dataset described above is further split into three datasets as explained below:
- Grid search training and validation set: these are the datasets that are used for tuning the hyper-parameters of our models, for each organization. We train a model with a set of parameters chosen from the grid on the grid search training set and measure its accuracy on the grid search test set. The parameters with the highest accuracy are chosen for training the other two models listed below.
- Model metrics training and validation set: these are the datasets used to measure the expected accuracy of our models when we generate prospect scores on the scoring set. The model metrics training set is the dataset on which we train a model using the optimal parameters derived from grid search described in the step above and the model metrics test set is the dataset against which we measure the accuracy of the trained model.
- Final model training set and scoring: this is the dataset used to train our final model to generate scores for prospects currently not linked to an opportunity. The dataset to the right of the training set used for the final model is the portion of prospects whose outcomes are censored. This is essentially the forecast horizon.

As illustrated above, each of the modeling datasets do not overlap in time to ensure that the model metrics reflect what is likely to be observed during the scoring of prospects with unobserved outcomes in the future.
Models
Our customers have data of various shapes and sizes, some have a wealth of historical data to learn from while others are just getting started. While some customers might benefit from more complex models for others with insufficient data, the baseline models might perform equally as well.
We currently have the following models in production:
- The unsupervised model which weighs recent activities highly, as we described above.
- A supervised XGBoost classifier with baseline time-binned activity signals as we described above.
- A XGBoost ranking model which ranks prospects by their projected ‘time-to-convert’.
- A XGBoost classifier trained on baseline activity signals combined with enhanced activity signals based on prospects’ interaction with specific marketing assets such as a particular product page, a specific campaign landing page etc.
Summary
In part one of this series, we established the motivation behind Einstein Behavior Score, a powerful tool for marketing and sales teams in enterprises and small businesses alike. We described the evolution in our modeling approaches and the challenges that motivated us to find effective solutions that worked for all of our customers.
In part two, we will describe our insights generation pipeline and our journey in model explainability. We will also show how each of the models we described above compete in a model tournament where the winner determines what scores and insights our customers ultimately see. Finally, we will also walk through the architecture that powers Pardot Einstein.


