

This was my second summer interning with Salesforce’s Sales Cloud Performance Engineering team. I feel nostalgic thinking about how much has happened since the first day I was welcomed in the team and how far I’ve come. Some of the opportunities I had included presenting my project at a Tech & Products Sprint Review, enjoying a day with my fellow #FutureForce interns on a cruise ship, and playing soccer with my team at the annual Goal Against Cancer charity tournament. Most memorable, however, are the amazing people who shared their enthusiasm and knowledge with me.
This year, I was given the challenge to investigate a bug in Google Chrome. The ‘Decrypting Chrome’ project taught me that performance engineering is the ultimate treasure hunt.
The Treasure
Any developer who’s looking to optimize the performance of a given page will use Google Chrome’s developer tools to figure out what’s going on and where time is being spent to load a page.
My team uses the timeline functionality the most to understand why a page might be slower than expected. Therefore, we were highly motivated to ensure the view was accurate.
Key points:
- When Chrome is aware of CPU activity, but is unable to identify the type of event (HTML, JavaScript, Stylesheets, or Media files), it’s categorized as miscellaneous resources (grey).
- When CPU events are identified as JavaScript, the Flame Chart allows the visualization of CPU JavaScript stack traces.
When navigating through certain Salesforce flows, large chunks of grey were showing up in the CPU section for the devtools’ timeline.
But, we discovered there was a problem. When the CryptoAdapter was disabled, the grey area highlighted below disappeared and the previously empty section of the Flame Chart filled up with JavaScript stack traces.

The Treasure Hunt
The investigation process is a treasure hunt. You gather clues as you learn more about the problem, allowing you to make progress by testing educated guesses. At times you might even feel like you’re going on a wild goose chase, but all those clues start adding up. Slowly over time, you determine the relationships between all the bits of information and start narrowing down the location of the treasure. For my ‘Decrypting Chrome’ project, this treasure hunt came with 5 ‘aha’ moments.
1. The Web Cryptography API causes the Chrome DevTools bug
Since disabling Crypto removed most of the grey area from the timeline, we believed the issue was caused by a combination of JavaScript, Crypto and maybe IndexedDB.
To further isolate the problem, I created a standalone HTML file using the Web Cryptography and IndexedDB APIs. In this HTML page, clicking a button called the function storeEncryptedObjectsArray.

StoreEncryptedObjectsArray would first create a Crypto key. This key would then be used to create an array of encrypted strings to be stored as individual entries into Chrome’s IndexedDB.

Recording the timeline trace for this code led us to determine that the Chrome issue wasn’t Salesforce-specific. A large grey area of “miscellaneous” CPU events was still showing up in the timeline.
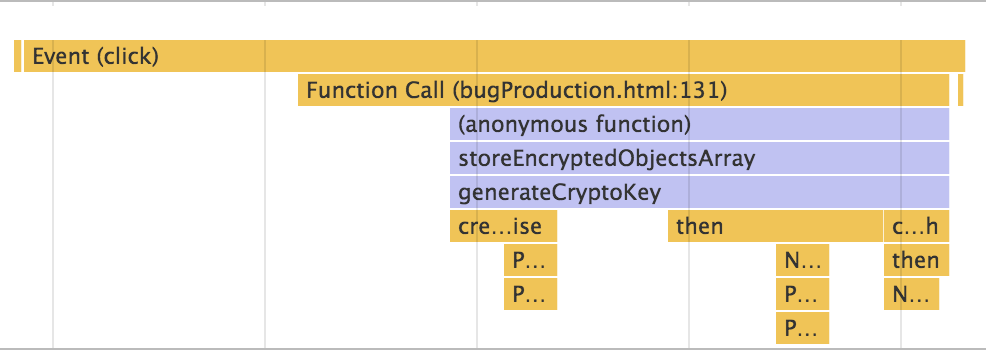
A closer look at this timeline’s Flame Chart revealed that the first chunk of JavaScript stack traces showed the user clicking the button, calling the StoreEncryptedObjectsArray function, and generating the Crypto key.

The next relevant JavaScript trace showed the success of opening Chrome’s IndexedDB. This meant that all the traces after the Crypto key is generated and before the browser’s storage is opened (doStuff, generateEncryptedArray) were missing.
With these new timeline traces, we concluded that the Web Cryptography API caused the Chrome DevTools bug.
2. The Cryptography API promise callbacks were missing from the timeline
Since the bug was related to the cryptography API, I checked out and built Chromium to take a closer look.
The process to have my own local version of Chromium up and running was surprisingly easy. The process is clearly documented at https://www.chromium.org/developers/how-tos/get-the-code. You just need patience, a lot of available memory, and powerful computer processors.
While my laptop was whirling away to compile Chromium, I started looking into the Cryptography API. The Cryptography API is a JavaScript API, built on promises, for performing basic cryptographic operations in the browser. This API is used, for example, to secure the confidentiality of data stored in client-side caches and to protect documents by encrypting them before they are sent over a network or uploaded to a remote service provider. The API is supported in most browsers, and the different browsers all follow the WCS specification for the API.

Although they follow this high-level specification, the specific implementation differs between browsers.
Through a process of stepping through Chromium code (made easier by https://cs.chromium.org/) and reading through existing Cryptography Chrome bugs, I developed this high-level view of Chrome’s implementation of Crypto for my standalone code.

- The main JavaScript thread created the promise for the Generate Crypto Key call. Relevant information was then passed to the ‘Crypto’ thread with a webarraybuffer.
- This ‘Crypto’ thread is ultimately a thread pool of size 1 where Crypto requests are queued and executed in FIFO order. This thread was where the native Crypto code generated the key.
- After the key was generated on the Crypto thread, the information was sent back to the main thread where this reply resolved the promise.
- Since the promise had been resolved, everything that I wanted to do after the successful key generation (doStuff and generateEncryptedArray) was then run. If you recall, these functions were the ones missing from the timeline.
With an understanding of cryptography on Chrome, we concluded that the Cryptography API promise callbacks were related to the missing timeline traces.
3. The information for the missing timeline stack traces was available but hidden from view
Since an initial hypothesis was that instrumentation was missing from the cryptography API, I used my local Chromium build to add trace events to the code.
Chromium has trace macros that are very low overhead. The basic format is to use TRACE_EVENTX or TRACE_BEGINX with TRACE_ENDX with X replaced with the number of additional arguments (0,1,2). The first argument is the category name, the second is the name of the trace event, and the X allows additional information to be placed into the trace. (https://www.chromium.org/developers/how-tos/trace-event-profiling-tool/tracing-event-instrumentation)
After consulting this trace event documentation, I added trace macros to all crypto related functions in the C++ Chromium code. Much to my excitement, the code compiled and my custom traces showed up in Chrome://tracing/. However, these traces were still missing from the timeline.
I opened a timeline Json file to figure out the differences between traces showing up in Chrome://tracing/ and visible traces in the timeline.
Through the process of analyzing custom traces, I knew that Chrome://tracing/:
- Shows traces on all threads
- Shows custom traces with selective category types
- Doesn’t display the JavaScript stack (Instead, you’d just see a V8 trace)
Since Chrome://tracing/ is less restrictive than the timeline, why not attempt manipulating and comparing one of these custom traces to determine what information was missing or needed to be changed for the trace to show up?
TRACE_EVENT0(“devtools.timeline”, “Crypto::subtle”) created

The trace was able to collect the following including about the function:
- Pid = process ID
- Tid = thread ID
- Ts = timestamp
- Ph = event type
- Cat = category
- Name = name of the event
- Args = additional provided arguments
- Dur = duration
- Tdur = thread clock duration
- Tts = thread clock timestamp
(See https://docs.google.com/document/d/1CvAClvFfyA5R-PhYUmn5OOQtYMH4h6I0nSsKchNAySU/edit for more on tracing format)
It was through comparing different traces in this Json timeline file that I also noticed another trace containing information about Cryptography APIs.
This trace contained a CPU profile, with all the JavaScript functions including Crypto.
Extracting this CPU profile from the trace event and loading it into the Profile view of Chrome DevTools showed that all the JavaScript stack information was there.

So the information for the missing timeline stack traces was available in the Json file, but why wasn’t it visible in the timeline?

4. The stack traces weren’t visible since ‘parent’ traces were missing
Since the stack trace information was there in the form of a CPU profile, I created my own timeline file to determine what makes these stack traces show up.
In the process, I noticed that most of the stack trace events that do show up on the timeline Flame Chart are grouped under ‘parent’ trace events like “Function Call”, “Animation Frame Fired” or “Timer Fired”.

But what is the relationship between a set of JavaScript call stack traces and these ‘parent’ traces?
After some investigation with my custom timeline Json file, I determined that ‘parent’ trace events with the right information(threadid, processid, category, name, and duration) would make the missing JavaScript stack visible.
5. V8ScriptRunner::callFunction is the key
With the source of the problem determined, I navigated through Chromium to isolate the lines of code creating the issue. By creating the ‘all’ xcode version of Chromium by using the -ide=xcode tag with gn gen and then attaching the running processes, I was then able to set breakpoints and step through code.
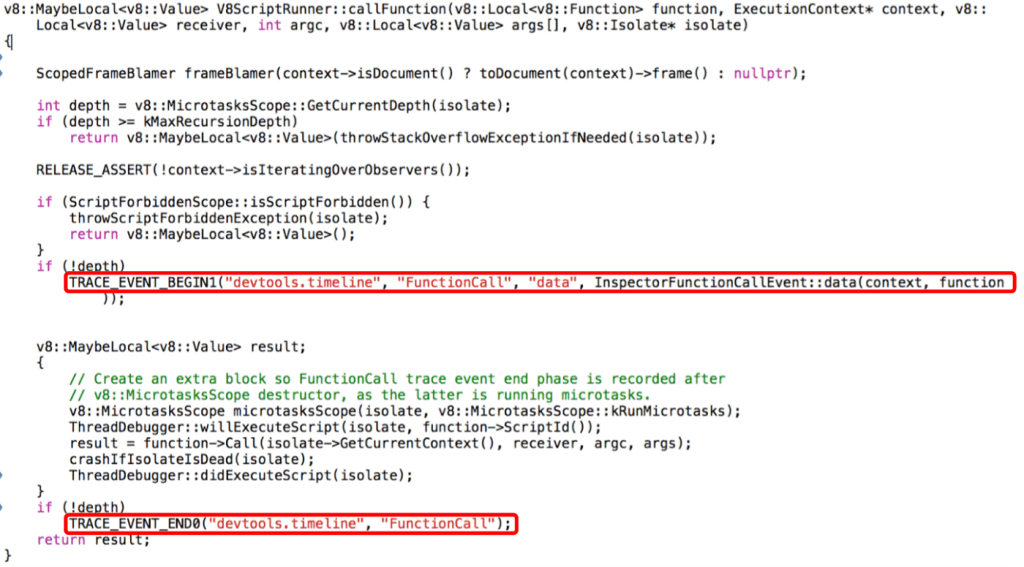
Through this process, I found V8ScriptRunner::callFunction, the function that creates the ‘parent’ “Function Call” trace events allowing the javaScript call stack to show up on the timeline.
Unlike the callback of request animation frame or set timeout, the Crypto callbacks weren’t getting routed through V8ScriptRunner::callFunction and so no ‘parent’ traces were being created.
A Taste of Gold
After embarking on this investigation, I created a patch for current timeline files.
Currently, Crypto traces exist in the timeline Json files as tasks processed from the work queue.

Parsing out these work queue traces related to Crypto provided the information to add new ‘parent’ traces, allowing our missing JavaScript call stack traces to appear.
A Thirst for More Gold
Treasure hunting isn’t an individual hobby. Salesforce’s Sales Cloud Performance Engineering team is filled with treasure hunters. I wouldn’t have gotten to this point without the help and advice of my team members who supported me through both my successful ‘aha’ moments, and my facepalm moments.
Even as I was crafting this blog post, we discovered a timeline that showed a large chunk of grey even after the file was patched for Crypto. Another API, based on promises, was also missing these ‘parent’ traces.
You see, performance engineering is the ultimate treasure hunt. It doesn’t end when you get your first taste of gold. The investigations are ongoing. This new discovery just gives me a new clue and another excuse to get back to the treasure hunt.


