In our Engineering Energizers Q&A series, we highlight the engineering minds driving innovation across Salesforce. Today, we spotlight Archana Indran, Senior Engineering Manager for Mobile CI/CD. Archana’s team built Analyze Build Tools, a growing system of AI-powered investigative skills that analyzes mobile CI/CD build failures the way an experienced support engineer would.
The Mobile CI/CD team is the central mobile build platform at Salesforce, powering managed pipelines for iOS and Android apps and SDKs across 60+ customer repositories spanning products like the Salesforce App, Mobile Field Service, Mobile Publisher apps (branded apps for digital experience sites), Tableau Mobile, Industries Mobile applications and Q3/Q4 Mobile testing pipelines to name a few, which serve hundreds of mobile engineers across Salesforce. By owning build infrastructure, code signing, artifact management and distribution, and now AI-powered investigation tools, the team directly accelerates developer velocity for every mobile product team shipping to customers.
Explore how an eight-person team supporting more than 60 mobile repositories transformed years of mobile CI/CD debugging knowledge into AI-powered investigative skills that reduced incident resolution time by 60%, cut Mobile build failure analysis by 75%, and are now evolving toward proactively detecting infrastructure issues before developers ever encounter them.
What is the mission of the Mobile CI/CD team, and what role does Analyze Build Tools play in helping you support mobile developers across Salesforce?
Imagine arriving at work to discover that mobile builds are suddenly failing across dozens of repositories. No one knows whether the failures originated in application code, Salesforce infrastructure, or an overnight API change from Apple or Google. The evidence is scattered across logs, historical build data, and operational metrics. Experienced support engineers can usually connect those signals within minutes but most developers cannot. The mission is to make sure they don’t have to.
The Mobile CI/CD team operates Salesforce’s central mobile build platform, powering Managed Pipelines for iOS and Android apps and SDKs across more than 60 repositories. Those repositories span products including the Salesforce App, Mobile Field Service, Mobile Publisher, Tableau Mobile, Industries Mobile applications, and mobile testing pipelines. By owning the end-to-end mobile build platform, from build infrastructure and code signing to artifact distribution and now AI-powered investigation tools, the team directly accelerates developer productivity for hundreds of mobile engineers shipping Salesforce mobile applications.
As more teams adopted the platform, the team discovered that building reliable mobile CI/CD infrastructure was not the hardest challenge. Scaling the investigative instincts that support engineers had developed after diagnosing thousands of build failures was. That realization led the team to build Analyze Build Tools. Rather than teaching AI how to read logs, the team taught it how experienced engineers investigate problems. It asks the same questions, gathers evidence across multiple systems, identifies recurring patterns, and determines whether a failure originated in the application, Salesforce infrastructure, or an external Apple or Google platform dependency.
The goal isn’t simply faster debugging, rather, it’s giving every mobile developer access to expertise that previously existed only inside the Mobile CI/CD team.
When an eight-person team had to support hundreds of mobile engineers, what challenges made the existing reactive support model difficult to scale?
The challenge became increasingly apparent as adoption of Managed Pipelines, the team’s declarative YAML-based CI/CD platform, grew to more than 60 repositories across Salesforce. To developers, every mobile build failure looked the same, but the root cause could be application code, Managed Pipelines, Salesforce infrastructure, or changes introduced by Apple or Google.
Under the original support model, every investigation started with the Mobile CI/CD team. Engineers manually correlated logs, build history, and infrastructure signals before determining where the problem originated. Over time, a pattern emerged. One developer reporting a failure usually meant an application issue. Several teams reporting similar failures at once almost always pointed to shared infrastructure. Support experts recognized those signals instinctively, but that knowledge existed only inside the team.
Supporting teams that consumed shared Mobile CI/CD libraries outside of Managed Pipelines added another layer of reactive support. With only eight engineers supporting a growing ecosystem of repositories, it became clear the team couldn’t scale by adding more people. They needed to scale expertise.
Analyze Build Tools captures much of that investigative process, allowing developers to perform self-service investigations before escalating issues.
After introducing Analyze Build Tools, what measurable impact did it have on debugging time, support workload, and the number of engineers and repositories your team could support?
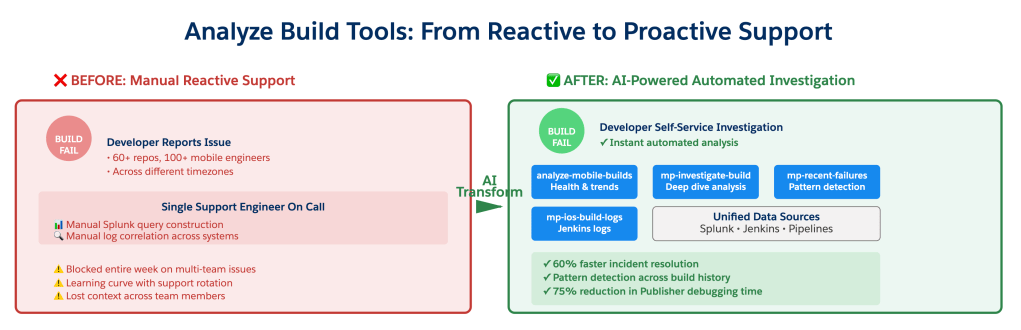
Before Analyze Build Tools, investigating a failed build meant manually constructing Splunk queries, correlating logs across multiple systems, and searching historical incidents before engineers could begin solving the actual problem. Analyze Build Tools automates that process through AI-powered skills like /mp-investigate-build, /mp-recent-build-status, and /analyze-mobile-builds.
Instead of searching logs, developers can simply ask: “Why did my latest build fail?” The AI gathers build history, correlates related failures, determines whether other repositories are experiencing the same issue, and identifies whether the likely cause originated in the application, Managed Pipelines, Salesforce infrastructure, or an external platform change from Apple or Google.
The impact on developer productivity was immediate. Incident resolution improved by approximately 60%, significantly reducing developer downtime during mobile CI/CD investigations, and Mobile build failure analysis and debugging effort dropped by 75%. Developers now arrive with context instead of questions because the AI has already gathered the evidence and narrowed the likely causes.
Instead of becoming the first stop for every failed build, the team now focuses on the relatively small number of issues that genuinely require deep infrastructure expertise. That allows eight engineers to support a growing number of repositories while spending more time improving the platform instead of repeatedly investigating the same categories of failures.
When developers needed answers instead of static monitoring dashboards, how did Analyze Build Tools learn to investigate build failures like an experienced support engineer?
The team’s first instinct was to build dashboards. The assumption was that if developers could see build success rates, failure trends, and operational metrics, they could diagnose problems themselves. The dashboards showed what was happening, but they couldn’t explain why. Developers still came back with the same questions: is this my code, a pipeline issue, something happening to other teams, or a change from Apple? The dashboards provided information, but engineers still needed a support expert to interpret it. That forced a complete rethink of the problem.
Experienced support engineers don’t investigate dashboards. They investigate hypotheses. When a build fails, they don’t ask “which system should I check first?” They ask “what’s the most likely explanation?” and then gather evidence wherever that explanation might exist. The team wanted Analyze Build Tools to investigate the same way.
Instead of searching one system at a time, the AI gathers evidence across Managed Pipelines, Splunk logs, historical metrics, and other internal data sources, correlates related failures, and builds a single investigation. It determines whether the issue is isolated to one application, affecting multiple repositories, or caused by infrastructure or external platform changes before presenting developers with the most likely explanation. Developers can simply ask “Why did my latest build fail?” or “Show me iOS builds that failed with provisioning profile errors during the last seven days.” Rather than returning raw data, Analyze Build Tools performs the same reasoning process an experienced investigator would and explains what it found. The breakthrough wasn’t replacing dashboards, rather, it was teaching AI how support experts build a case.
As Analyze Build Tools evolves beyond debugging assistance, what challenges are you solving next to automatically detect issues and notify customers before they encounter them?
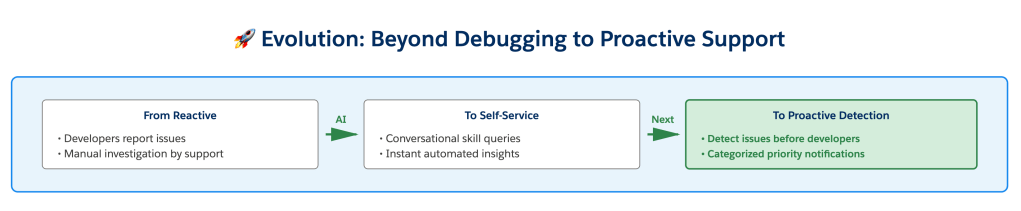
Today, Analyze Build Tools helps developers investigate failures after they occur. The next objective is ensuring many of those investigations never need to happen.
The team is building proactive AI-powered issue detection that continuously monitors mobile build health, identifies abnormal patterns, and notifies customers before developer productivity is affected across hundreds of mobile developers working in different time zones. Notifications are categorized by priority so developers receive actionable alerts without unnecessary noise. Designing that notification system is just as important as detecting the issues themselves. If every anomaly generates an alert, teams quickly stop paying attention, so the focus is on notifying the right teams at the right time with information they can immediately act on.
The team began by teaching AI how experienced support engineers investigate build failures. Now they’re teaching it to recognize the earliest warning signs of those failures and notify developers before they ever need to ask why their build broke. Ultimately, the best build investigation is the one developers never have to perform.
Learn more
- Stay connected — join our Talent Community!
- Check out our Technology and Product teams to learn how you can get involved.