

In our “Engineering Energizers” Q&A series, we highlight the engineering minds powering innovation across Salesforce. Today, we meet Geeta Shankar, a performance engineer driving the development of Code Builder — the browser-based IDE with integrated AI that enables Salesforce developers to write, test, and execute code without any local setup.
Explore how Geeta’s team optimized startup latency while managing infrastructure costs, built AI-powered systems to prevent regressions, and scaled Code Builder globally to handle region-specific concurrency — ensuring a fast, reliable developer experience at any scale.
What’s the biggest performance challenge the team solves in Code Builder — and how does the mission support AI-enhanced developer productivity at scale in Salesforce?
The Platform Performance Engineering team at Salesforce ensures that Code Builder remains performant, scalable, and cost-efficient, even under high-concurrency developer workflows. One of the biggest challenges is maintaining a fast and consistent user experience while supporting Dev Assistant, an AI tool integrated into the IDE that allows for prompt-based code generation and execution. Code Builder eliminates the need for local setup, connecting developers directly to Salesforce orgs. To deliver this fluid experience, the team employs strategic warm pool provisioning, telemetry tuning, and workload modeling.
Simulating real user patterns helps validate latency, idle behavior, and recovery under load. During high-traffic events like Dreamforce, traffic modeling becomes crucial. Baselines are established through JMeter simulations, and dashboards are created using CI/CD telemetry. AI-assisted testing pipelines and region-aware analysis ensure that startup times remain low and regressions are prevented, keeping Dev Assistant responsive even during peak usage.
Geeta explores the culture behind Salesforce Engineering.
What AI-powered R&D at Salesforce helps address performance challenges in Code Builder and Dev Assistant?
Key R&D areas focus on enhancing AI prompt behavior and proactively detecting performance issues. The team tests Dev Assistant completions in metadata-rich scenarios to spot hallucination risks and model gaps. Any issues are promptly shared with the Agentforce team for tuning.
For better observability, the team uses Meta’s Prophet model to forecast hourly, daily, and weekly traffic patterns. Prophet flags anomalies by identifying deviations from dynamic confidence intervals, helping to detect early performance drift.
To speed up debugging, Gemini auto-generates SQL queries and dashboards from internal telemetry systems housed within databases such as Trino. This has cut dashboard setup time by over 70% and allows for prompt-level telemetry analysis to pinpoint friction points, latency issues, and usage differences across regions.
The team is also building structured LLM observability tools to summarize prompt behavior, correlate outcomes with system state, and visualize AI-driven impact at scale. These tools create a closed-loop feedback system: prompt quality is continuously tested and improved, performance is AI-forecasted, and telemetry is visualized in near real-time, enabling faster issue resolution and smarter optimization.
What are the regression risks in shipping new Code Builder IDE features, and how do AI-driven test systems reduce them?
The biggest risk is introducing subtle issues that degrade startup speed, Dev Assistant responsiveness, or the overall user experience without causing outright failures. To tackle this, the team developed “performance workloads”—automated tests that simulate real developer activities. Each build in the staging environment is compared to historical performance data. These tests cover launching a session, writing and executing AI-generated code, idling, and reactivating the environment. If any metrics drop, Slack alerts immediately highlight the specific test, the change in performance, and the potential impact.
To ensure comprehensive coverage, AI generates tenant-specific test scenarios. For instance, when telemetry showed a mismatch in usage patterns for a specific region, the team introduced a region-specific workload. Cursor created these tests to accurately reflect the unique flows of region-specific performance by customizing boilerplate API calls with the appropriate logic.
This approach allows the team to quickly spot significant performance issues, reduce blind spots, and maintain high confidence in every Code Builder deployment.
Geeta explores a new AI tool that helps her team solve performance challenges.
How does the team maintain trust and system stability in Code Builder — while using AI testing to expand coverage without slowing release velocity?
To keep the system reliable and maintain rapid development, the team embedded automated testing throughout the delivery pipeline. AI continuously expands functional test coverage, covering API calls, UI actions, and session flows. Cursor generates test logic that integrates seamlessly with CI/CD pipelines and staging environments. These tests run nightly to check latency, correctness, and regressions. If any issues arise, Slack alerts provide immediate, detailed feedback, helping developers fix problems without slowing down the process.
For unpredictable behaviors, the team uses AI for blitz testing. Cursor suggests edge cases like malformed prompts or high-load concurrency loops, which are hard to create manually. Internal databases like Trino and UIP feed real-time usage data into the testing framework, allowing the team to link failures with specific session signals, such as prompt failure rates or latency spikes.
This integration of test automation and observability ensures that edge-case issues are caught and resolved before they impact a large number of developers.
How did the team overcome the cost-versus-latency tradeoffs of AWS warm pools in Code Builder — and what role did AI-powered test automation play in optimizing developer experience?
Managing warm pools, which are pre-initialized compute instances that eliminate cold-start delays, required the team to balance startup latency with idle infrastructure costs. Overprovisioning in global regions led to unnecessary expenses, while underprovisioning increased cold starts and degraded user experience.
To optimize this balance, the team used AI to automate performance simulations. With Cursor, JMeter-based load tests were generated in 1-2 hours instead of days. These tests modeled session launches, idle behavior, and reconnections, covering both typical and edge-case concurrency scenarios.
This allowed the team to run experiments across APAC regions and simulate over 500 concurrent Dreamforce sessions. The results were shared with AWS partners to support billing exemptions for scale testing. By integrating AI into the testing workflow, the team accelerated optimization, reduced engineering effort, and maintained reliable latency while keeping infrastructure costs under control.
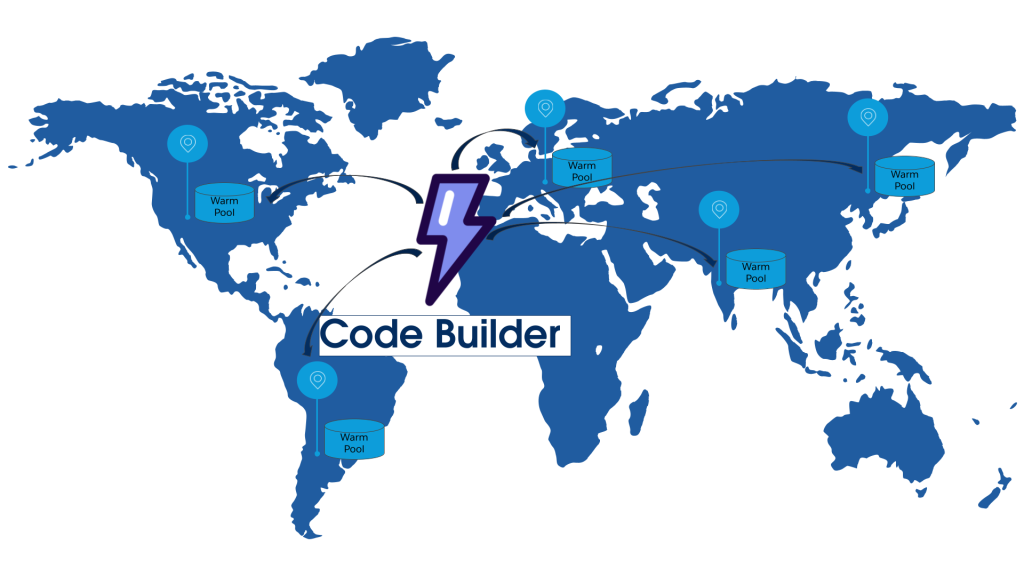
Global reach on Code Builder optimized with warm pools.
How does the team handle Code Builder global scaling on AWS, and how is AI used for regional concurrency simulation and cost optimization?
Scaling Code Builder globally is a delicate balancing act. You need to ensure top performance without breaking the bank on AWS infrastructure. Warm pools, which keep compute instances ready to go, can rack up significant idle costs if overprovisioned. On the other hand, under-scaling can lead to frustrating cold-start delays for developers.
To tackle this challenge, the team leverages AI to create concurrency simulation tests that are customized for each region. For example, Cursor helps build test scenarios that mimic the burst of activity during Dreamforce workshops in North America or the growing demand in APAC.
These simulations provide valuable insights into how to adjust warm pool sizes, autoscaling policies, and startup time thresholds. The results are then shared with AWS to negotiate billing adjustments during high-scale testing periods.
By integrating region-specific load testing with AI-driven simulations, the team can deliver smooth, low-latency experiences while keeping infrastructure costs in check. Every decision is data-driven, ensuring that performance is optimized and resources are used efficiently.
Learn more
- Stay connected — join our Talent Community!
- Check out our Technology and Product teams to learn how you can get involved.


