By Siddharth Sharma, Suvhrajit Basak, Kusum Dhalia, and Nabeel Qaiser.
Your compute bill keeps climbing, and your Spark workloads keep succeeding. Successful execution tells you the configuration worked. It does not tell you how much of the allocated capacity the workload actually needed. Cutting CPU, memory, or executors without that evidence can turn potential savings into slower runs, expensive retries, or production failures.
At Salesforce Data 360, the team faced that question across roughly eight million Apache Spark workload executions a day, ranging from short runs to workloads processing terabytes over several hours. They needed to distinguish unused capacity from memory pressure and shuffle bottlenecks, preserve performance and reliability, and collect the evidence without requiring application code changes.
Where do you find that evidence and how do you turn it into an optimization you can trust?
Why does Spark resource sizing leave compute unused?
Consider an illustrative example: Your job starts 40 executors and completes successfully, but most perform no useful work at startup. The allocation creates pod churn, node churn, and unused capacity without producing a job failure. How would you recognize the waste if successful completion was the only outcome you examined?
The team encountered that pattern in a Data 360 workload. Its configuration requested 40 executors at startup, yet most had no useful work initially. Did the application need that capacity immediately or could it start smaller and add executors as demand appeared? A fixed resource profile could not answer that question. Neither could an estimate based on tenant and data volume, an approach other workload owners used. Both helped teams choose an allocation before submission, but neither revealed how that allocation behaved during execution.
Successful completion is evidence of a working configuration, not an efficient one. Comparing requested resources with useful work helps you investigate whether it allocated more than necessary. Execution history becomes feedback for the next decision, including whether resource sizing is the problem you should solve.
How do you collect Spark telemetry without application changes?
You are responsible for workload efficiency, but application teams own the code. Asking every team to add instrumentation creates an integration project before you can investigate the waste. How do you obtain comparable evidence without changing those applications, or introducing another way for them to fail?
For the 40-executor workload, the team needed more than a success status. Which executors received tasks, how much CPU and memory did they use, and did execution spill or retry? Consistent measurements would let the team investigate other workloads using the same definitions.
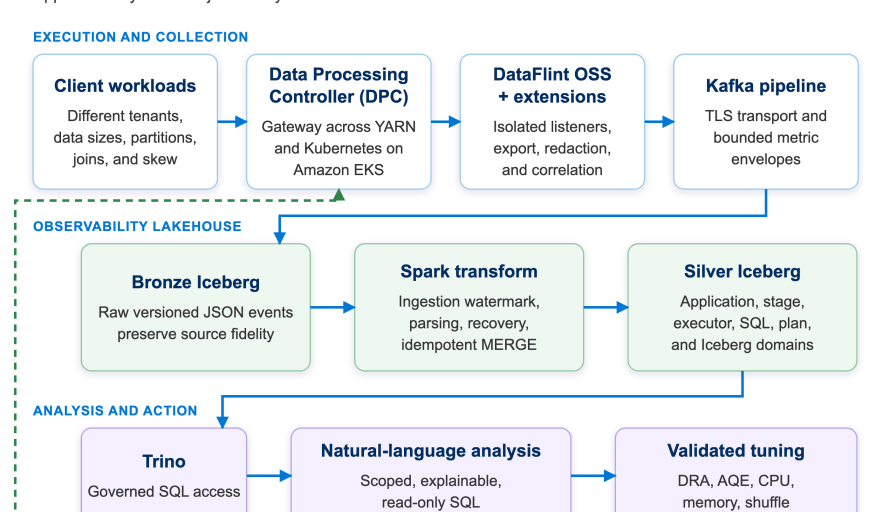
The integration point was the Data Processing Controller, or DPC, the common gateway for managed Spark submissions supporting Data 360 ingestion, segmentation, and activation. Agentforce interactions also send data into the platform. The gateway provided a shared place to instrument workloads without changing application code. Spark exposed listener hooks that let the team observe execution independently of that code. The team extended an open-source DataFlint Spark plugin and injected it when DPC constructed a submission. The listeners collected telemetry in each Spark driver and exported it through Kafka into a central Iceberg lakehouse.
Collection also had to remain safe. Listeners used a dedicated listener-bus queue, and submissions continued if instrumentation could not be configured or initialized. Alerts monitored export failures and telemetry gaps so the platform team could investigate missing evidence.
Look for an equivalent shared boundary in your platform. It can provide consistent Spark observability while keeping collection isolated from customer computation. But collecting the same metrics everywhere is only the beginning: you still need to interpret them correctly.
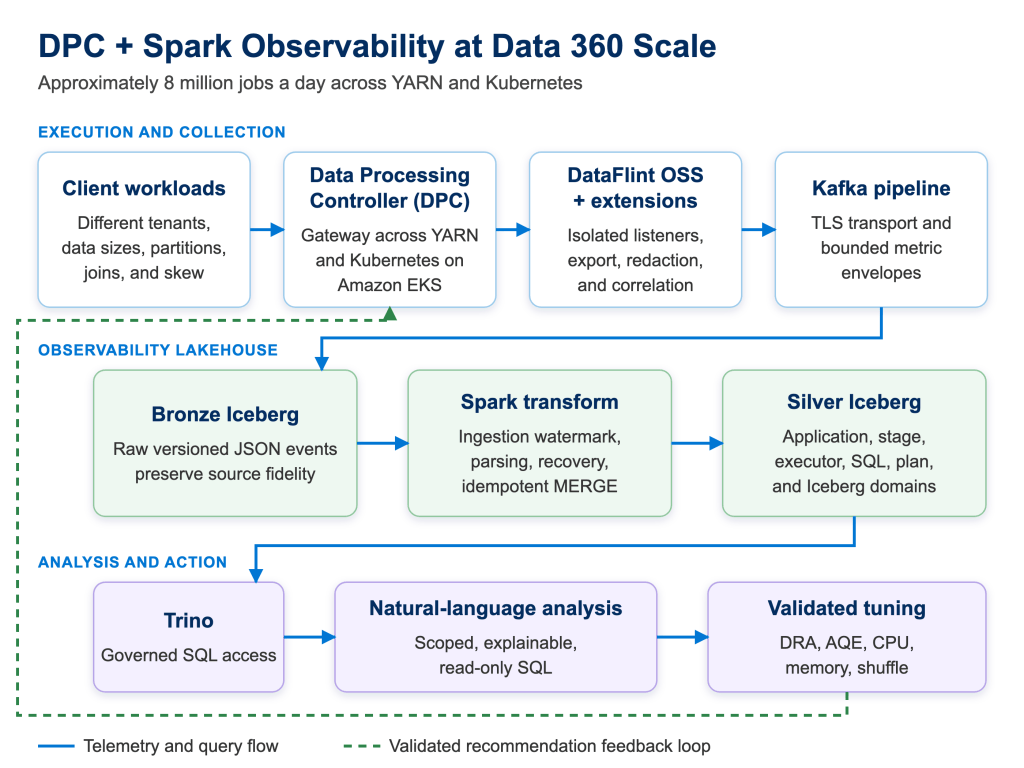
Client jobs are submitted to DPC, which enables an instrumentation plugin that captures metrics and emits them to Kafka.
When do Spark metrics produce misleading sizing recommendations?
Consider a common analysis scenario: Your query succeeds and returns a convincing optimization candidate. Yet incomplete applications, missing records, or miscounted retries can distort the result before you change a single setting. How do you know the apparent waste belongs to the workload rather than to your analysis?
An incomplete execution cannot establish what a complete run needs. A fleet average cannot establish the requirements of the particular workload starting 40 executors, either. A useful comparison needs a defined workload, environment, and execution boundary. Retries introduce another distinction. A retried Spark stage represents additional billed work, but counting every attempt as distinct logical work distorts an analysis of successful execution. Similarly, memory spill and disk spill describe different representations of the same pressure event; summing them as independent bytes produces a misleading total.
For Data 360 workloads, the team encoded these semantics in a curated analytical layer called Silver. Its structured model covers applications, jobs, stage attempts, executors, and related domains. Right-sizing decisions used complete Spark application runs within defined workload and environment scopes, while reliability investigations also examined failures and retries. The analysis explicitly identified missing or partial measurements. Cost needed a consistent boundary too. The team summed the driver pod and all executor pod costs for each Spark application, enabling comparisons of the same workload before and after a change.
Before interpreting an aggregate in your system, establish what it counts, which executions it includes, and where evidence is missing. Those definitions make the next question answerable: where should you investigate first?
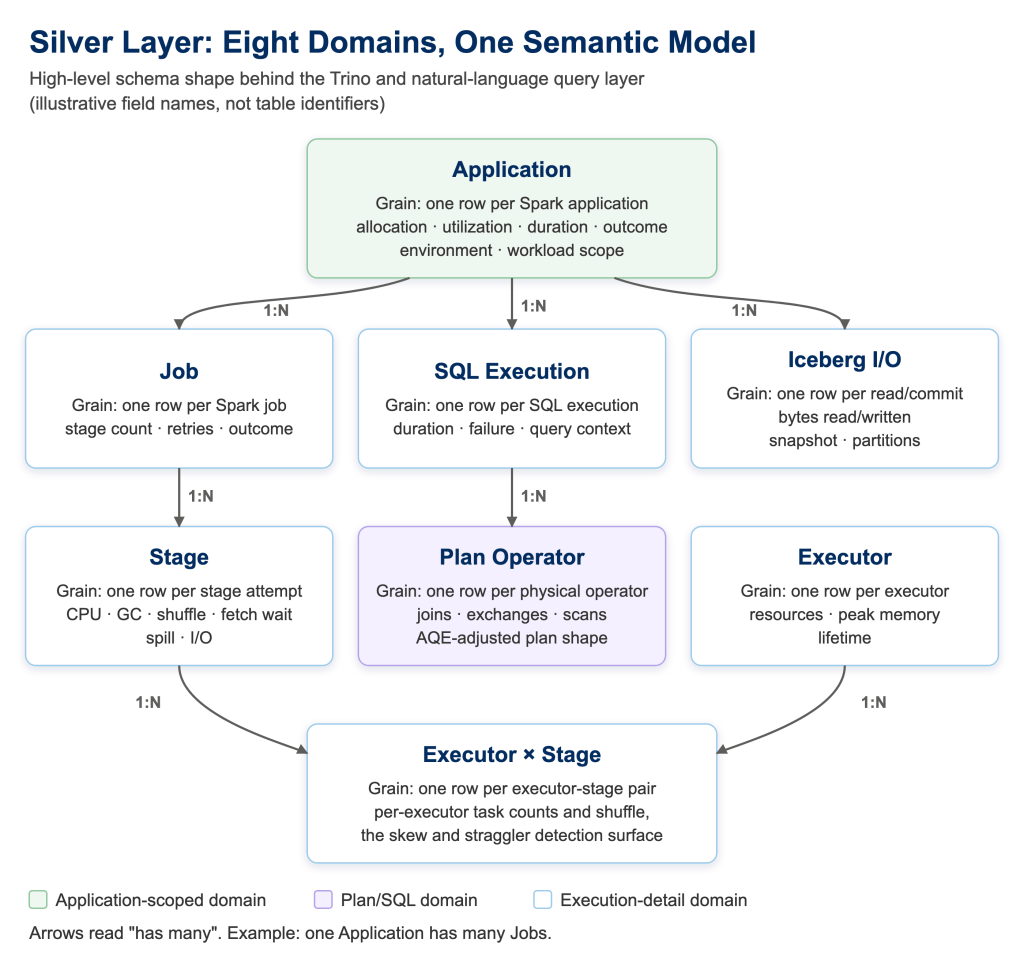
Silver’s analytical model connects Spark applications, jobs, stage attempts, and executors, preserving the execution context needed for reliable analysis.
Does low Spark executor utilization indicate waste or a bottleneck?
Imagine a workload whose executors are mostly idle, making a resource reduction look obvious. But a heavy-shuffle workload with fetch failures may need reliability work, while executors completing zero tasks may indicate unnecessary allocation. Which symptom supports investigating a smaller profile, and which points to a different problem?
The team started with a concrete question: which expensive workloads repeatedly allocate executors that complete zero tasks? The team ranked the top ten Data 360 workloads using cost to serve, CPU idle time, and zero-task executors. This focused attention on significant, repeated waste rather than treating every low-utilization job as equally valuable. Answering that question required preserving workload and environment scope and interpreting executor measurements correctly. The team exposed Silver through Trino and built an agentic profiling skill that generated SQL from plain-language questions. Its answers included the SQL, formulas, and assumptions, allowing engineers to review the evidence behind a recommendation.
For the startup investigation, executors with no useful work supported testing a smaller initial allocation. Among executors that received tasks, high CPU idle time revealed a different pattern: much of the allocated CPU remained unused. The team examined those signals alongside observed peak CPU and memory use, executor concurrency, and spill behavior. Heavy-shuffle fetch failures prompted a separate reliability investigation. Low CPU utilization alone did not establish that capacity could be removed, and zero-task executors did not establish the exact replacement count. First determine whether the evidence supports a resource-sizing experiment or an investigation into execution behavior; then choose the intervention.
Resource sizing is one optimization path. If your investigation points toward how work is distributed, explore how to optimize your Spark application with partitions.
How do you validate Spark resource optimization in production?
You have identified sustained waste, but a smaller profile remains a hypothesis. Will it save money without increasing runtime, spill, retries, or failures, and without creating Kubernetes platform pressure? A recommendation becomes an optimization only when subsequent runs demonstrate lower cost with acceptable performance and reliability.
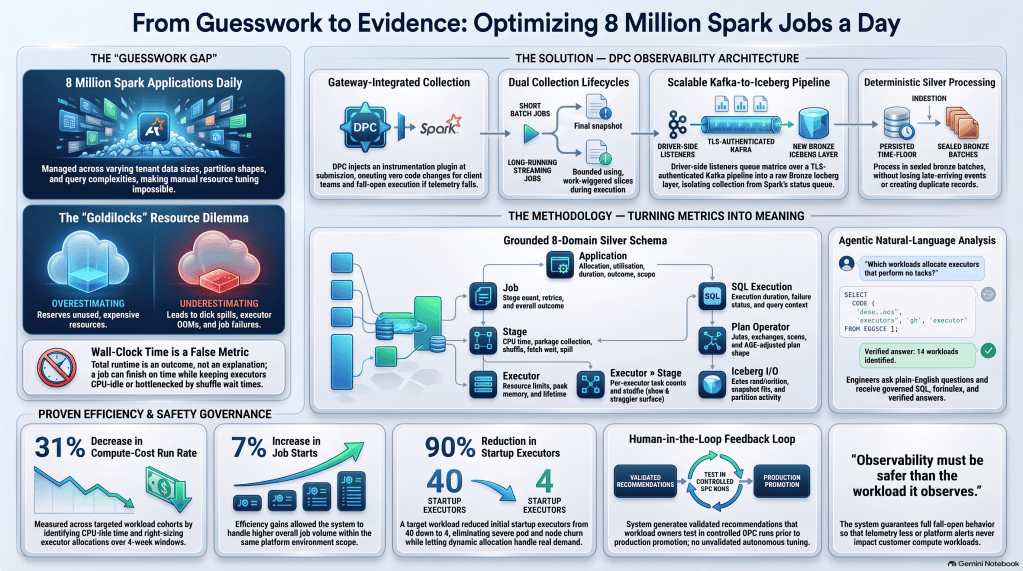
For that same Data 360 workload, the team reduced initialExecutors to 4 and retained Spark dynamic allocation. This reduced the startup allocation while allowing capacity to grow when needed. After more than a month in production, the smaller start removed waste without an unacceptable runtime, retry, or failure regression. In a separate cohort of Data 360 workloads, the team observed more than 90% executor idle time. To test whether a lower executor ceiling could reduce unused capacity, the team reduced its maximum-executor limit by roughly 20%, keeping the rest of the Spark profile unchanged. More than a month of production observation showed acceptable runtime, spill, retries, and failures. Both changes were validated for their workloads; neither establishes a universal Spark setting.
The team rolled changes through lower environments and production in stages. Before advancing, the team checked p95 runtime, retries, OOMs, and spill, alongside pod churn, node churn, IP-prefix consumption, and etcd pressure. A change had to remain acceptable for both the application and its execution platform. Across targeted Data 360 workloads, weekly compute-cost run rate fell 31% in matched four-week windows before and after the changes. Separately, DPC job starts across the same environments increased by more than 7%. This was a before-and-after comparison rather than a controlled experiment, so other changes during the period may also have contributed.
Next, we are exploring workload-level rollups above Silver that make common insights available without SQL or the natural-language skill. We are also exploring how DPC could automatically apply validated recommendations, bringing observation, diagnosis, and optimization into a tighter feedback loop built on trustworthy telemetry.
Pro tip: Start tomorrow with one expensive recurring workload. Compare requested capacity with useful work across complete, comparable runs, investigate the cause of idleness, and test a targeted change. Evaluate compute cost alongside runtime, spill, retries, and failures before expanding the rollout. You do not need eight million daily executions to apply this lesson. Treat resource estimates as hypotheses, use execution evidence to choose a change, and let subsequent runs establish whether it worked. That is how Spark resource optimization becomes a repeatable engineering practice.
Learn more
- Stay connected — join our Talent Community!
- Check out our Technology and Product teams to learn how you can get involved.