

Visibility is everything.
At least, it is if you’re a company that runs 24×7 production infrastructure. If you can’t see what’s going on with your systems, at a glance, it’s next to impossible to run systems with high availability. And, as your systems grow in size and complexity, this quickly goes from “challenging” to “downright impossible” if you don’t have the right tools at hand.
At Salesforce, this is something we think about a lot. We have hundreds of software stacks, running in data centers all over the world, serving mission-critical applications for the world’s most successful companies. Keeping all of that humming along, while serving billions of transactions every day, is no small feat.
In this post, we’re excited to share Refocus, a new tool we’ve created, that helps our Site Reliability Engineers do just that. We use it at Salesforce, and we’re releasing it as open source so you can use it, too.
In The Beginning
To understand why we built Refocus, you have to take a step back and look at the history of system monitoring at Salesforce. In the beginning, our entire service revolved around one single CRM application. Monitoring was relatively easy as everyone worked on the same product, and when something went amiss, there was plenty of “tribal knowledge” about how to fix it. Monitoring was mainly a list of Nagios alerts that Site Reliability engineers watched to quickly resolve problems.
This was a great solution at the time — as Salesforce architect Bala Subramanian would say, it wasn’t too big. As our infrastructure and products expanded, our engineers were expected to respond to new alerts, in huge volumes, often for services they’d never seen before. Soon, no single person could tell you how Salesforce was working because we now had a disparate monitoring infrastructure. Even the system we built to correlate events across the entire infrastructure (code-named “focus”) was creaking under the weight of so many new services. We knew it was time to rethink and retool. We knew we had to Refocus!
Designing For A New Focus

As we sat down to design a better monitoring platform, we knew it would have to do one thing really well: connect all of our numerous monitoring sources into a single, self-service platform. As part of that goal the platform would have to visualize the health of many services in a manageable way. Our old platforms didn’t handle either of these requirements well and the platforms were disjointed, noisy, and hard to use. We also knew that we wanted to build Refocus as an open source project, from the ground up.
To focus our design efforts, we identified the three main issues we wanted to solve:
- Connect all monitoring sources into one platform.
- Quickly onboard new services.
- Visualize the data in ways that make sense to all users.
Connecting Sources
In order to connect many sources to Refocus, we needed a flexible data model and an intuitive API. We surveyed the various systems we were attempting to monitor and noticed a trend towards natural hierarchies. So we designed a flexible, hierarchical data model which could be adapted to just about any use case. We based our object model on the concept of a Subject; as the Refocus docs explain it:
“A Subject is anything that can be monitored. Yes, we mean anything! In Refocus, subjects are the center of our data model.”
For each Subject, there are various characteristics that we care about. In Refocus, an Aspect represents each of the different characteristics of a monitored subject. An Aspect can be anything that is measurable including things like “request latency”, “login success rate”, “average network speed”, “message queue backlog”, and much more. Aspects allow you to define different states, such as“healthy”, “warning”, and “critical”.
The keystone of the data model is the Sample. In Refocus, a Sample is the value of an aspect for a particular subject at a specified point in time. Samples can be associated with Subjects at any level of the hierarchy, and they’re updated as time passes. In our instance of Refocus, we handle tens of thousands of Samples a minute, because there are tens of thousands of data points we care about!
You can see how all this fits together here:

Onboarding Customers
A monitoring platform is only successful if people actually use it, so we spend a lot of time thinking about onboarding new services. We aim to make onboarding easy by providing a robust API and customizable metadata. There are many reasons for being API-focused, but it was mainly to drive adoption within our own engineering teams. All Refocus interactions are exposed via an API; there are no secret backdoors. Although it required additional effort to build Refocus this way, it forced us to build intuitive endpoints that are easy to integrate with.
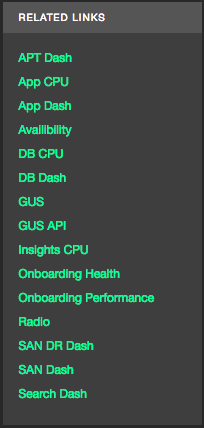
In addition to the API, we added several metadata options to our objects. At a minimum, every object has a set of tags, a list of related links, and some description fields. All of this allows us to reduce the need for tribal knowledge by providing all the relevant information about the service in a single place for all users. Here’s an example:
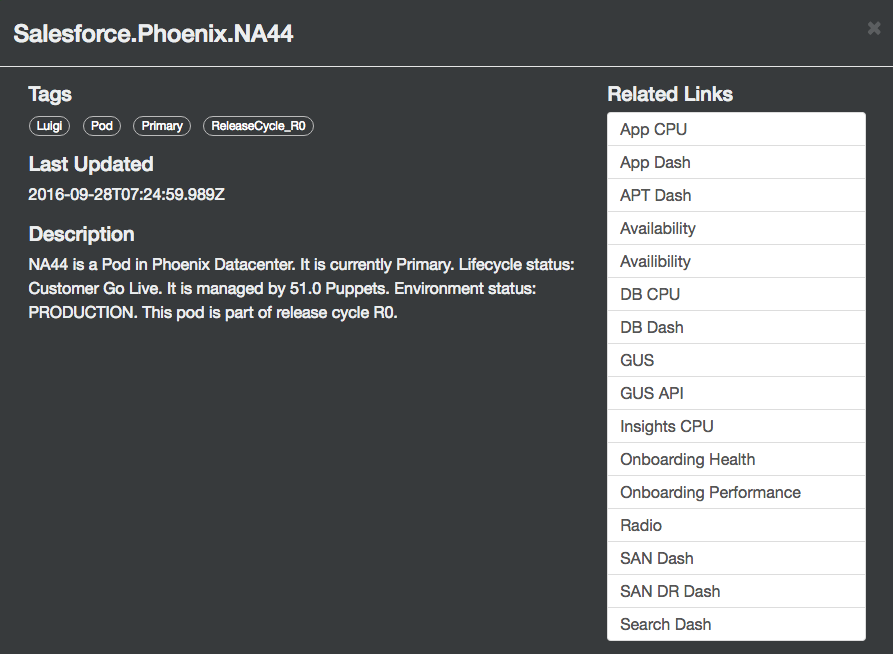
Tags allow us to filter and group our Subjects. In this example, the subject has a tag of ReleaseCycle_R0, which allow us to group all of our “Pod” Subjects which have major releases at the same time. We also have a list of related links that allow us to dive into other relevant information for this Subject. These same metadata features exist on every object, which gives us a really powerful view of our services.
Visualizing Data

The final problem we had to solve was visualizing the data. It is downright impossible to visualize thousands of real-time data points in a way that makes everyone happy. For weeks, we went back and forth on different UI designs that might satisfy every user, but no interface was perfect.
Eventually we said, “To hell with trying to solve every use case with one UI!” Instead we designed an abstraction that we call a Lens that allows anyone to build and deploy a custom visualization. We defined a handful of events that could affect the state of the data in the Refocus UI, and then we exposed APIs that a developer could implement in order to create real-time visualizations. We also built a Lens Developer Kit that allows users to quickly prototype and package up new lenses to deploy on Refocus. The end goal is to create an ecosystem where anyone can create and share Refocus Lenses.
Use Cases
The best part about Refocus is that it’s already solving a ton of real-world problems!
Salesforce Global Site Reliability
My team, Site Reliability Tools, builds tools for Salesforce’s Global Site Reliability organization. They’re our number one customer. Their top priority is ensuring that the services our customers rely on are working flawlessly.
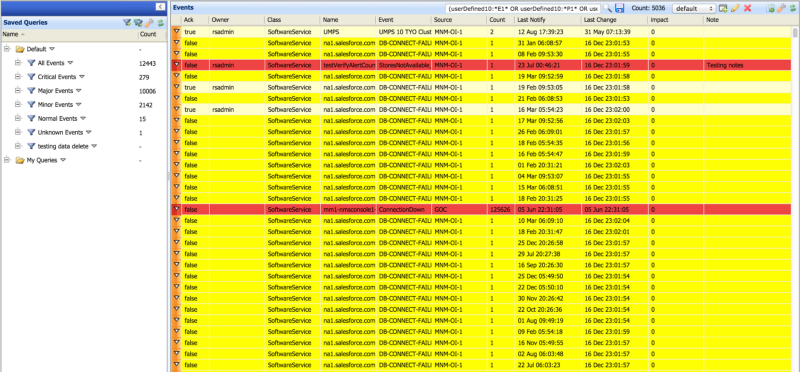
To help them with that mission, we built a Lens and Subject hierarchy that would visualize the health of Salesforce from a customer’s perspective. This view only shows the health of the core services, broken out by instance (CS22, NA21, etc.) because our Site Reliability Engineers (SREs) need to focus on managing ongoing incidents, not dealing with noise.
Now Site Reliability has all the important information in a unified view, and an SRE can easily identify hot issues that need attention. This is also where metadata comes in handy because it allows us to provide relevant links within Refocus so an SRE can immediately dig in and figure out what exactly is going wrong.
Customer Dashboards
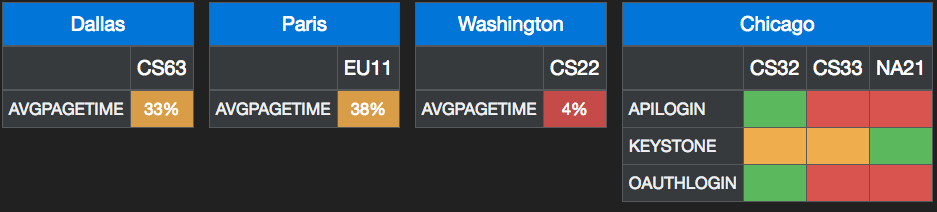
The second adopter of Refocus was our Customer Centric Engineering team (CCE). This team practices what we preach about “customer love” and they are always looking for ways to take on the customer’s view. When we introduced them to Refocus, they were immediately drawn to the flexible, hierarchical data model and started work on a Refocus dashboard that would surface a handful of Aspects on a per-customer basis:

Refocus is the first time they have been able to holistically visualize the health of our individual customers in real time! As Markus Spohn, on our CCE Devils team, put it:
“Refocus will enable MCS to monitor customer org health, much like Site Reliability monitors infrastructure health today… it will provide seamless integration between monitoring and diagnostic tools, which will help streamline the troubleshooting process and resolve critical customer issues faster.”
Database Build and Deploy
As you might know, Salesforce is a very database-centric product. Do our database administrators use Refocus? You bet! In fact, they were the first team to build and deploy their own lenses! They use Refocus as a realtime checklist of steps that need to happen in order to deliver new database capacity. For this they needed two new Lenses:

The first was for the engineers and project managers on the team to visualize each individual step in the build process. When everything turns green they know they are ready to accept customer traffic. They built a second view, which is a summary so that executives can, at a glance, see the progress of database builds.
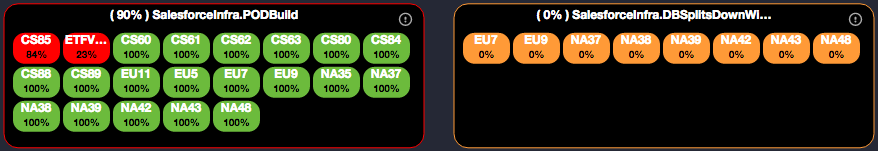
Both of these Lenses were built and deployed entirely by the Database Team using the Refocus Lens Developer Kit.
Outside Salesforce: Zuora Infrastructure Monitoring
“Teams here are seeing the value and lining up for Refocus.”
Jeff Feldstein, Zuora

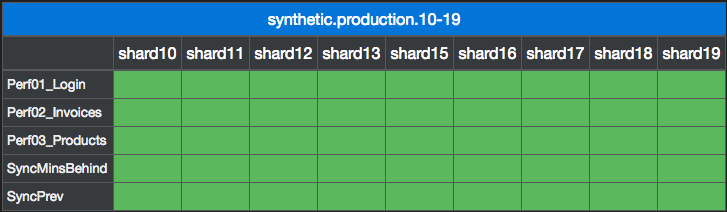
Perhaps the best test of Refocus has come from our first alpha users, Zuora. Zuora, like Salesforce, has monitoring infrastructure that has grown massively over time. While they were considering the idea of forcing everyone to use the same platform, they were dreading the thought of trying to switch everyone off of their current system and onto a unified one. Luckily, with Refocus, they were able to pipe in data from their various monitoring sources without forcing any heavy-handed changes. Zuora started out monitoring their data sync with Salesforce, but they have quickly started onboarding new services, and plan on rolling out Refocus across the company.
Conclusion
We couldn’t be more excited about Refocus! It is making a huge impact in how we visualize our service health within Salesforce, and provides a level of transparency that we have never had before.
Remember these three main issues we wanted to solve?
- Connect all monitoring sources into one platform.
- Quickly onboard new services.
- Visualize the data in ways that make sense.
We think we have solved them with a platform that is flexible enough to suit almost any use case. Now that Refocus is open source, we are looking forward to more people using it and influencing Refocus’ future development. We welcome your feedback and contributions on our github repo and are excited to see the novel ways people solve their problems with Refocus!
Acknowledgements
This wouldn’t have been possible without our outstanding Refocus developers and designers: Ian Goldstein, Shriram Shankar, Pallavi Singh, Anny He, Eduardo Sanchez, Jee Hwang, Harsh Kothari, Niamh O’Kane, and Alok Gupta!
P.S We will be speaking at Dreamforce if you want more details on how Refocus helps Salesforce be transparent.


