In our “Engineering Energizers” Q&A series, we highlight engineering leaders driving impactful advancements. Today, we feature Adam Chit, who leads Salesforce’s monitoring agent team in evolving the observability platform — the default monitoring solution across all Salesforce clouds. By developing an in-house Application Performance Monitoring (APM) Agent, Adam’s team ensures seamless user experiences and upholds Salesforce’s core value of trust. Through both out-of-the-box auto-instrumentation and emphasizing zero-code custom instrumentation, adoption of open standards like OpenTelemetry for consistent data handling, and interlinking telemetry data—metrics, traces, and events—they aim to improve Time to Resolve (TTR) across Salesforce’s complex systems.
Discover how his team tackles challenges in producing and managing vast telemetry data, achieving consistent data formats across diverse programming environments, and ensuring Salesforce’s observability platform remains secure, responsive, and scalable to meet the company’s evolving needs.
What is your team’s mission?
Our mission is to develop advanced agents that generate high-quality observability data, supporting Salesforce’s monitoring and performance goals. We are committed to enhancing Time to Detect (TTD) and Time to Resolve (TTR), particularly for complex, distributed microservice architectures.
Through both out-of-the-box auto-instrumentation and emphasizing zero-code custom instrumentation—which allows engineers to configure observability settings through configuration files without modifying application code — open standards like OpenTelemetry, and integrating metric data with traces and events, our aim is to provide a unified, scalable monitoring solution. This solution enhances visibility and reliability across Salesforce’s applications.
This unified approach enables teams to troubleshoot more quickly, ensuring that Salesforce services remain highly available and meet rigorous performance standards.
Adam explains why engineers should join Salesforce.
What was the most significant technical challenge your team faced recently?
A recent significant challenge was developing and deploying agents across the diverse programming languages used at Salesforce to ensure telemetry data remains actionable and accessible on a user-friendly platform. To unify data formats across these agents, we implemented a standardization layer that harmonizes telemetry data from various languages and agents, creating a consistent format across Salesforce. Built on OpenTelemetry, this layer enables seamless interlinking of data, allowing teams to track issues across metrics, traces, and events with ease.
Key features of our APM platform, powered by this unified telemetry from our agents, include:
- Deployment Annotations: With Deployment Annotations, every deployment is marked directly on your performance charts. This feature enables teams to correlate performance shifts with specific deployments instantly, streamlining the troubleshooting process.

Deployment Annotations mark each deployment directly on performance charts, allowing teams to instantly correlate shifts in memory usage with specific deployments.
- Insight Points: Insight Points enhance our APM functionality by providing a configuration-based zero-code instrumentation solution that generates R.E.D. (Requests, Errors, Duration) metrics from custom points in your application, offering granular insights not previously possible.

Insight Points Overview showing R.E.D. (Requests, Errors, Duration) metrics from custom points in your application.
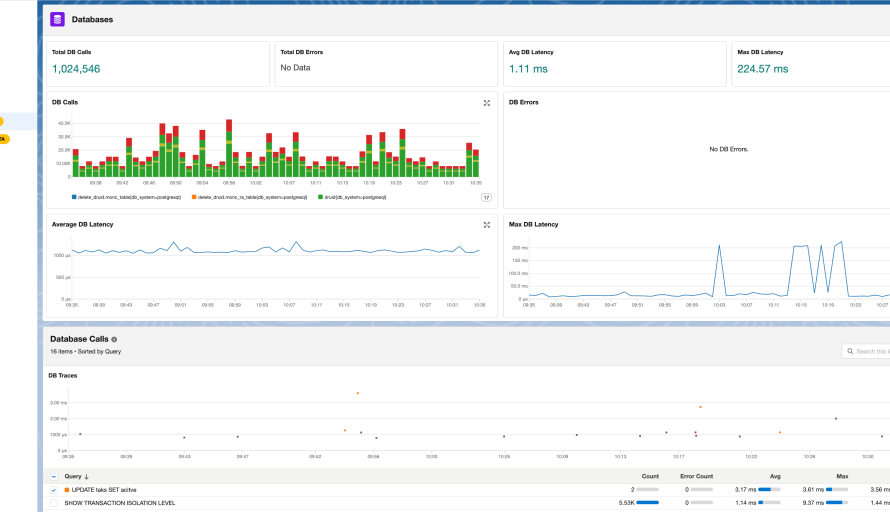
- Database Monitoring: Slow database queries can be silent killers of application performance. The Database Insights feature provides a detailed view of database operations, allowing teams to visualize total calls, identify errors, and analyze latency trends over time.

Database Montioring page powered by Agent telemetry, supporting analysis of query load and performance patterns.
These strategies enable Salesforce teams to efficiently manage, analyze, and troubleshoot telemetry data across microservices, ensuring performance insights are accessible and actionable at every level.
How do you manage challenges related to scalability?
Scalability is essential for our observability platform, which processes one trillion transactions each month. To meet these demands, we manage scalability on two fronts: deployment scalability and data scalability.
For deployment scalability, our APM agents are deployed across 30,000 applications that span VM-based, Kubernetes, and first-party (1P) host environments, with support for multiple programming languages to cover a diverse infrastructure. The team maintains a robust testing framework, including a test bed for performance and integration testing across all agents, ensuring high reliability under varied workloads. Our trusted deployment pipelines facilitate smooth rollouts with canary releases and staggered deployments, guaranteeing safe, stable, and controlled updates to production.
For data scalability, we optimize telemetry generation and data processing pipelines. This enables APM agents to focus on critical anomalies, prioritizing essential insights without overwhelming users or backend systems with redundant data. By interweaving metrics, traces, and events, we deliver a comprehensive view for rapid identification and resolution of issues in large-scale, distributed systems. Detailed, short-lived traces support active troubleshooting, while aggregated metrics provide early warnings of broader issues.
Together, these strategies allow our platform to meet Salesforce’s high transaction volume requirements while ensuring that observability remains responsive, reliable, and efficient across both deployment and data scales.
Can you describe a time when your team had to pivot or adjust your strategy unexpectedly in this project? What prompted the change, and what was the outcome?
Initially, custom instrumentation required manual code changes, which was burdensome for internal teams managing complex applications. Based on extensive feedback, we transitioned to a zero-code approach, allowing teams to configure telemetry directly through configuration files – which will generate the standard generates R.E.D. (Requests, Errors, Duration) metrics for users. This shift simplified the deployment process and increased adoption by enabling engineers to customize observability without altering core application code.

Manual vs. Zero-Code custom instrumentation comparison chart.
The result was a more accessible and agile observability platform that catered to the diverse needs of Salesforce’s engineering teams. Today, zero-code custom instrumentation is a cornerstone of our platform, empowering teams to implement tailored monitoring solutions efficiently and securely across various applications.
What ongoing initiatives are improving the platform’s capabilities?
Our ongoing research and development efforts focus on enhancing the capabilities of our APM Agent and platform to provide even deeper insights and more proactive monitoring. This includes:
- Integrating Advanced Analytics and AI: We’re exploring the use of machine learning algorithms to predict potential performance issues before they occur.
- Optimizing Data Interlinking: Further improving how metrics, traces, and events are interwoven to provide more actionable insights and reduce TTR.
- Optimizing Data Processing: Continually improving the efficiency of data collection and processing to handle increasing data volumes without latency.
- Expanding Technology Support: Extending auto-instrumentation to cover more frameworks and libraries used within Salesforce.
Adam dives deeper into the role of OpenTelemetry and AI at Salesforce.
What’s the importance of keeping observability data within Salesforce rather than using external solutions?
Keeping observability data within Salesforce is essential for security and maintaining customer trust. This data offers valuable insights into real-time customer interactions, making its protection paramount. External observability tools could expose this data to third-party vulnerabilities, posing potential security risks.
Developing our platform in-house ensures that telemetry data remains securely within the Salesforce ecosystem, aligning with Salesforce’s “trust-first” philosophy and reducing reliance on external solutions that could compromise data privacy. This approach not only enhances data security but also allows us to leverage Salesforce’s powerful data and analytics capabilities, including Salesforce Data Cloud and Agentforce. By applying AI/ML to this data, we can offer smarter insights and analytics in a cost-efficient manner, enabling predictive monitoring and anomaly detection across large datasets.
By managing observability data in-house, we create a trusted, reliable environment that prioritizes data privacy, resilience, and deeper integration with Salesforce’s infrastructure, ultimately offering our customers enhanced security and insights.
Learn More
- Stay connected — join our Talent Community!
- Check out our Technology and Product teams to learn how you can get involved.


