Almost always, when people talk about microservices, they focus on the pros of running the microservices in isolation: different programming languages, independent deployments, ownership by small teams. But running several services together as one product is rarely the focus.
My team supports one such product that is on its way to general availability in production. One of the areas we focus on is how to answer a simple question: “Is the product available to customers or not?” The question sounds simple, but the answer is hidden somewhere in those microservices.
Top-Down approach: see the forest for the trees.
We started answering the question from the product level: what does it mean for the product, in general, to be available? Going the other direction is almost impossible because of the variety of services.

The answer to the question is: the product is available if customers can reach out to it and if all the main functions are available. This answer has one measurable parameter — connectivity. The second half of it can be expressed through the availability of the individual services.
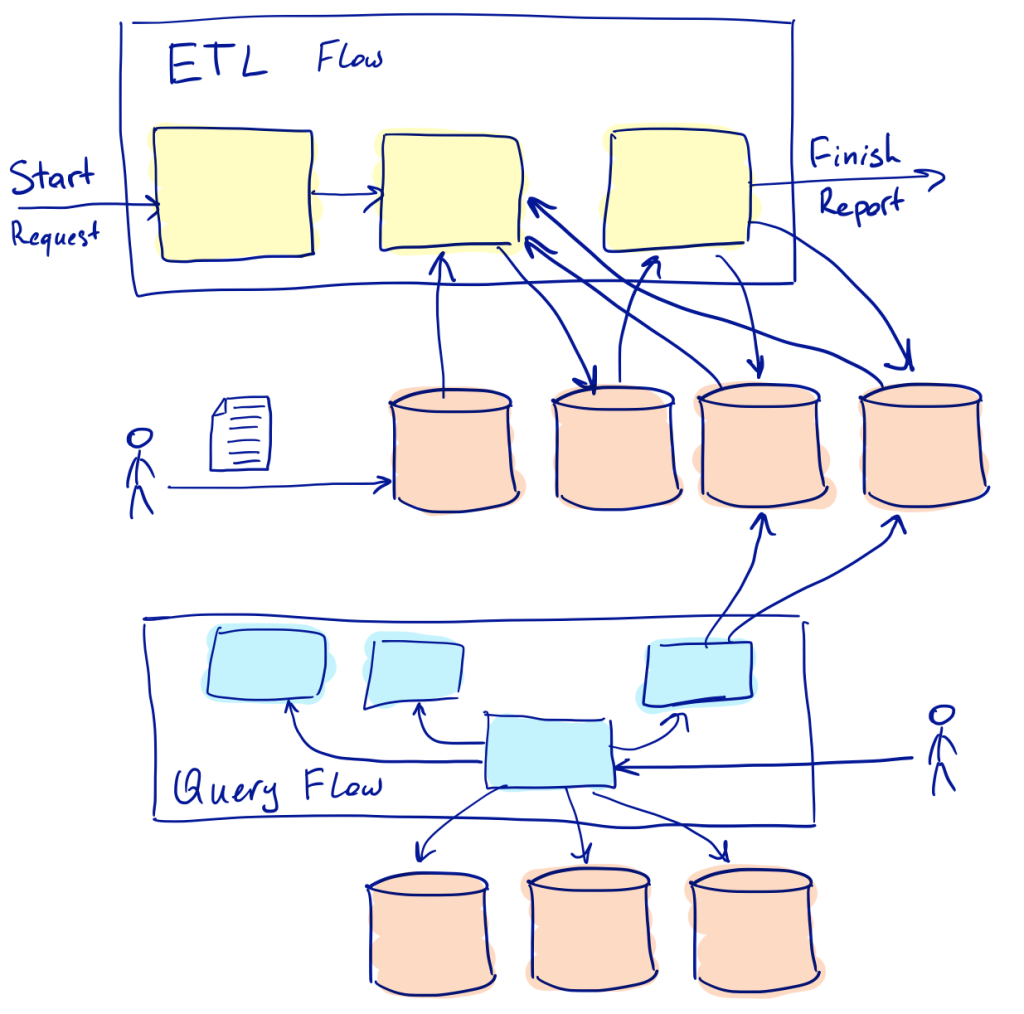
Let’s take, for instance, these two data flows implemented in the product: data ingestion and data query. Each of them has different characteristics: one is asynchronous and slow, another is synchronous and fast; they are built from different groups of services. So the availability of each of the flows should be measured differently.
Availability of the synchronous flow
Data query is synchronous in the system: a customer sends a query into the system and waits for a response. The request can result in multiple calls to different services behind the scene, and all of them are synchronous by nature.
The data retrieval process is available if we can give positive answers to two questions:
- Do most of the responses complete faster than some time?
- Is there enough capacity to keep serving the requests?
To answer the response time question, we measure the time it took to respond to each request coming into the system and compare a high percentile of the distribution with a threshold value.
It’s not as simple to answer the second question because individual microservices dictate capacity constraints to the product. What we can measure at the product level are the requests rate and the concurrency of the requests (how many of them are in flight at the same time). An increase in the requests concurrency without a significant increase in the requests rate means that the flow hits a performance bottleneck in one of the services.
Availability of the asynchronous flow
Data ingestion is an asynchronous ETL process. A customer points to a data source, the process extracts data from the source, transforms it, and uploads it into a data store. Depending on the volume of the data and kinds of transformations needed, the process may take from seconds to hours. If something goes wrong, certain parts of the process can be replayed.
The data ingestion process is available when all of these questions have positive answers:
- Can customers initiate a new ETL job?
- Do we have enough space to store the results of the job?
- Will customers have a consistent experience while using the system?Will the time to complete similar jobs (in terms of volume and complexity) be the same?
The target data storages are managed services for us, so the question about the space is on owners of the services. We focus on the ability to start new jobs and on the consistency of the customer experience.
When the new ETL job is scheduled, some information can be collected right away: whether the system has enough capacity to process the job and whether the data for the job is available to the processor. Some additional information on throughput and the responsiveness of external services is available while ETL makes progress through the task. These metrics are invaluable for capacity planning and progress tracking, but two aspects may keep us from relying on only these metrics:
- If we need to know the availability of the ETL flow even when no job is scheduled.
- If processing time for a record depends on the content; for example, it may trigger optional phases. Then it’s hard to compare throughput for records with different flows.
Synthetic transactions to the rescue
Synthetic transactions are useful when the flow of events generated by customers is uneven with spikes and long periods without any activity. They allow simulating the flow of events similar to those generated by customers, and the flow has a known profile. They also help us to confirm that it’s possible to connect to the product from different places.
Execution of the same or similar ETL workloads at regular intervals gives us numbers to track the performance characteristics of the system as well as the availability of the ETL component.
Synthetic transactions in the data retrieval flow help us to track the availability of that component when the flow of requests generated by customers is insufficient for statistical analysis.
From the product to the microservices level
The synthetic transactions are useful to track availability at the product level, but, when something goes wrong, it is crucial to have a way to find a root cause of the problem as fast as possible. Proper instrumentation of every service helps to converge the troubleshooting process quicker.
Instrumentation of microservices is approached from two directions: some metrics are there to support performance and availability indicators that came from the product level, and others were added to support a sufficient level of observability for each of the microservices. All the metrics at the microservice level belong to one of the categories:
- metrics to support criteria of availability for a particular instance of the microservice
- metrics essential for capacity planning or those needed to detect resources saturation
- metrics helping to understand the internal state of the instance of the microservice. These are useful for troubleshooting scenarios.
Watching each other
Earlier, we described a top-down approach to monitoring a product composed from microservices. It is essential to do horizontal monitoring of the microservices, too: how do they communicate? Are there availability issues between different microservices?

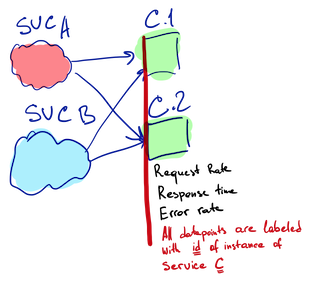
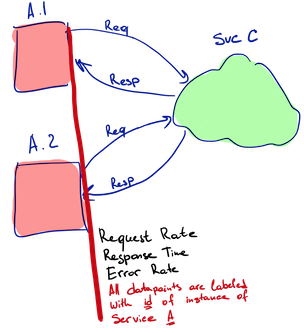
It’s unusual when a single instance of the microservice is running. Typically several instances of the same microservice run in parallel and they balance workloads among themselves. Communication between microservices is often a many-to-many: “Service A communicates with Service B” usually means multiple instances of Service A communicate to different instances of the Service B. All the instances may be scheduled to different physical hosts, communicate through different routers and actually can run various versions of code.
External monitoring to observe the quality of the service-to-service calls is complicated because of the high number of variables. But it is trivial if services can track by themselves characteristics of the calls they make and the calls they receive. Every instance of Service A performs outbound monitoring of its requests to Service B. Every instance of Service B performs inbound monitoring of all requests it receives, including those from Service A.

Outbound monitoring helps us to move from the more generic question “Is service B available” to a simplified but still sufficient version of it: “Is service B available to service A?” Inbound monitoring helps to correlate changes in the incoming flow of requests with changes in other metrics. We talked more about these types of monitoring in the blog post “Monitoring Microservices: Divide and Conquer.”
Most of the communications between microservices in our product go through a service mesh: services talk to each other over a flat network, traffic enters the network through smart gateways and leaves through other smart gateways. The gateways have good insights into the traffic going through and they are able to report various metrics about it. This technology gives us metrics for the inbound and outbound monitoring for free.
Other types of monitoring
All the text above is about metrics, but there are other mechanisms of monitoring: tracing and logs.
Beyond the usual role of describing internal state changes in a textual format, logs are the best place to keep metrics for each ETL job: how many records were processed, how many new records were added into the data store, how long did it take, and so on. Metrics systems can keep these numbers too, but, because the measurements have to be labeled with a job ID in addition to all other labels, it is expensive, resource-wise, to use metrics store for that. Job ID has high cardinality, but all the metrics stores are designed to deal with low cardinality labels. Also, a timestamp isn’t important for these numbers, unlike a metric for CPU usage. They can help with troubleshooting and capacity planning, but they are useless on a chart for operational monitoring.
Traces play an essential role in both flows of the product: they can help to see how a request travels through a chain of microservices in the data retrieval flow, and they can follow individual record as it goes through different phases of the ETL process.
Traces are orthogonal to metrics in some sense: a metric is information about all events that passed a particular checkpoint over some time; a trace is information about a single event that passed different checkpoints.
Conclusions
Monitoring a product built from microservices isn’t an easy problem to solve. It’s possible to formulate a question about availability at the product level, but all measurements to support the answer reside at the level of microservices. Often each of the microservices is owned by a separate team, so metrics implemented by each team should follow some common standards to be composable: we want to compare apples to apples, not pigeons to corn.
Extra coordination isn’t something people usually mention when they talk about the pros of doing microservices, but that’s the only way to build a product from smaller and often independent components. For example, to make distributed tracing possible, all teams owning services in the chain of calls must implement necessary transformations to pass trace ID along.


