

By Scott Chang and Indira Iyer.
In our “Engineering Energizers” Q&A series, we shine a spotlight on engineers who are pushing the boundaries of innovation and tackling complex technical challenges. Today, we feature Scott Chang, Principal Software Engineer at Salesforce. Scott’s team is responsible for developing and maintaining the Generative AI Provider Health Dashboard, a real-time observability system that monitors the health and performance of AI services from multiple providers.
Discover how his team addressed the challenges of integrating AI providers with inconsistent reporting, balanced real-time monitoring with cost and performance considerations, and scaled the dashboard to support Salesforce’s expanding AI ecosystem, all while dramatically reducing incident response times.
What is your team’s mission?
The AI Platform Infra Team at Salesforce ensures the stability, reliability, and security of AI infrastructure. The team develops and maintains the Generative AI Provider Health Dashboard, a cutting-edge internal monitoring system that offers real-time observability into AI service performance. This system enables proactive incident detection and minimizes downtime. The dashboard is deeply integrated with Agentforce, ensuring that AI-powered workflows remain available and reliable.
Prior to the dashboard’s development, the team relied on manual status checks across multiple AI providers, such as OpenAI, Azure OpenAI, and Google Gemini. Each provider had different reporting mechanisms, leading to significant delays in identifying outages. By centralizing AI service health monitoring, the dashboard has reduced incident response times from over an hour to just 5-10 minutes. This improvement has also enhanced vendor accountability, with OpenAI migrating Salesforce to a more stable compute cluster based on proactive tracking. Additionally, 99.9% of incidents are now detected before customers notice, drastically reducing the impact of downtime.

Overall Status shows availability of each provider by color differentiation. The tile turns red if it drops below SLA.
What were the biggest technical challenges your team faced in integrating multiple generative AI providers into a single dashboard?
One of the most complex challenges was standardizing health data across multiple AI providers. OpenAI, Azure OpenAI, and Google Gemini do not adhere to a unified API standard for reporting service status. Some providers offer REST APIs for status checks, while others rely on HTML-based status pages, necessitating web scraping to extract data. This inconsistency posed significant hurdles in creating a real-time, automated monitoring system that accurately reflects AI service health.
To overcome these challenges, the team developed a multi-source data ingestion pipeline that integrates:
- API queries for providers with structured health endpoints.
- Web scraping via AWS Lambda functions for providers without APIs.
- Automated AI model testing that proactively send queries to AI models to detect failures before providers report them.
Additionally, historical API availability tracking was implemented, enabling engineers to analyze longitudinal AI service stability. By combining these approaches, the dashboard provides a single source of truth for AI health, tracking 33 OpenAI services while filtering out non-impacting alerts.

The team monitors 33 OpenAI services and filters out non-impacting alerts.
How did your team optimize real-time AI monitoring while managing cost and performance trade-offs?
Initially, the team implemented a high-frequency monitoring approach, sending health-check prompts to OpenAI every minute to detect disruptions as quickly as possible. However, this could result in excessive costs and unnecessary compute cycles, given the volume of AI services being monitored.
For proactive monitoring of all service SLA targets and to minimize incident detection time at provider layers while maintaining low costs, the team set the monitoring to every minute. This approach will undergo periodic review to make necessary adjustments.
The system also introduced dynamic monitoring intervals, where services with frequent degradation are polled more aggressively, while stable services are monitored at lower frequencies. Additionally, adaptive traffic shaping ensures that AI providers are not overloaded with unnecessary health checks, preserving service quality while maintaining early detection capabilities.

Metrics observed from an end-to-end FIT test, historical status and incident count history provides the team with different angles of view, which enhances observability.
What scalability challenges did your team encounter as the dashboard expanded to monitor additional AI models and providers?
As Salesforce expanded AI capabilities — particularly with Agentforce and RAG 2.0 — the volume of AI traffic has steadily increased, requiring adaptive scaling. The original dashboard was designed to track a fixed set of providers, but new models and configurations introduced additional monitoring complexity.
One of the biggest scalability challenges was handling increased AI traffic loads while maintaining real-time data ingestion. The team had to ensure that the dashboard remained performant, even as the number of AI services monitored continued to grow.
To address these challenges, the team implemented an adaptive monitoring system that dynamically adjusted polling frequency based on AI provider performance trends. When an AI service demonstrated stability over time, the system reduced polling to optimize resource usage. For providers with frequent service fluctuations, monitoring intervals were adjusted dynamically to capture real-time disruptions. Additionally, load-balancing mechanisms were implemented to distribute monitoring tasks across multiple AWS Lambda instances, preventing performance bottlenecks as the dashboard scaled.
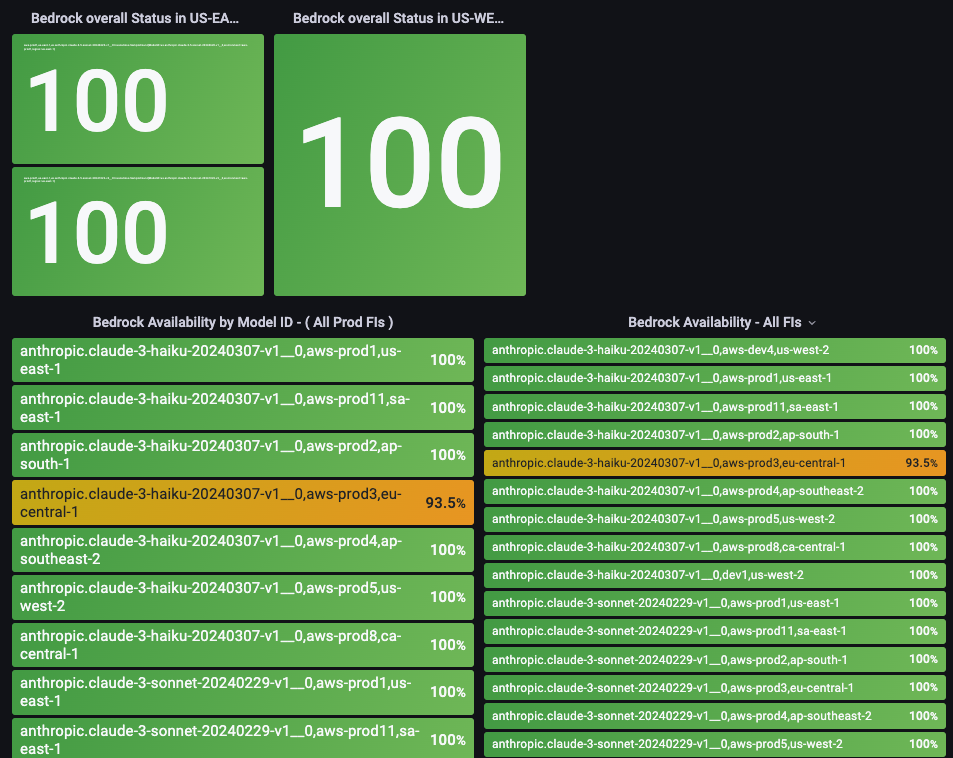
Monitoring availability by region and model increases observability accuracy, providing a clear path for incident response.
What were the biggest trade-offs your team had to make when balancing cost, performance, and accuracy?
One of the biggest trade-offs involved balancing monitoring sensitivity against AI provider-reported status accuracy. Many AI providers do not report outages immediately, meaning that an AI model could be degraded even if the provider’s status page says it is operational.
To address this, the team built heuristic-based validation mechanisms that compare provider-reported status with real-time traffic data and AI performance metrics. If discrepancies are detected, the dashboard escalates the issue internally. This ensures that Salesforce engineers are alerted to problems before official provider reports surface.
Additionally, latency trade-offs were a challenge. Increasing polling frequency could improve response time, but it also risked creating false positives due to temporary slowdowns. The system now dynamically calibrates its polling rate based on AI service behavior, reducing unnecessary escalations while maintaining fast failure detection.
Since launch, how has the dashboard improved AI service reliability and incident response times?
Before the dashboard, AI incidents were often detected after customers reported them, delaying resolution by over an hour. With the dashboard in place, automated escalation mechanisms now trigger immediate PagerDuty alerts and Slack notifications when an incident is detected.
Additionally, historical failure tracking has allowed the team to identify recurring degradation patterns, proactively working with AI providers to resolve systemic issues before they escalate. The dashboard’s insights also led OpenAI to move Salesforce to a more stable compute cluster, improving overall AI service uptime.
Since the dashboard launched, the number of AI service disruptions has decreased, particularly for OpenAI, as the company has responded to Salesforce’s proactive incident tracking. By integrating automated alerting, real-time health monitoring, and predictive failure detection, the team has significantly improved AI service reliability while reducing the operational burden on engineers.
How has the dashboard’s architecture evolved based on real-world performance data?
Early versions of the dashboard frequently triggered false alarms, causing engineers to ignore non-critical notifications. The team implemented intelligent correlation analysis, which compares multiple AI provider signals to determine if an issue is isolated or widespread before escalating an alert.
Dynamic alerting thresholds now adapt to real-time AI provider performance trends, preventing unnecessary escalations while ensuring critical incidents are flagged. The team also developed a historical anomaly detection model, leveraging past service disruptions to predict expected fluctuations versus actual failures, reducing false alarms by 60%.
Service degradation tracking now integrates longitudinal AI performance analysis, allowing the system to recognize long-term trends rather than reacting to one-time fluctuations. This refinement has made alerts more actionable and further reduced false positives.
By leveraging historical data, adaptive alerting, and correlation-based issue detection, the dashboard has evolved into a highly efficient AI reliability monitoring system. Engineers can now focus on genuine issues rather than filtering out noise, resulting in faster incident resolution and minimal false alarms.
Learn more
- Stay connected — join our Talent Community!
- Check out our Technology and Product teams to learn how you can get involved.


