Kunal Nawale is a Software Architect for Monitoring Cloud at Salesforce who designs, architects, and builds Big Data Systems.
In the early part of my career, I spent several years writing telecommunications software. One thing I learned from there is that it’s possible to build a highly reliable system from unreliable components. If you look at Public Switched Telephone Network (PSTN) phones, they continue to work under extreme conditions of failures like earthquakes and power outages. This article is about how we applied one of those design patterns in our distributed metrics platform and solved one of the reliability problems.
But before we go into the solution, let’s look at what our metrics platform looked like before this change.

With this architecture, we were able to scale our platform to meet our growing needs. But as our scale increased, we started having availability problems. We were missing our weekly availability Service Level Agreement (SLA) quite often. This was impacting our customers (internal salesforce employees).
Alerting is our most critical need at Salesforce. Most of our Salesforce infrastructure and related applications rely on Argus alerting. So it is imperative that Argus Alerting stays up. We did an analysis of one year’s worth of SLA misses and found the following areas contributing to the failures.
Ingestion Layer Problems:
- Mirus, our Kafka topic replicator, would go down and replay metrics
- A sudden influx of metrics on one Kafka topic could cause an ingestion slowdown for all topics
Query Layer Problems:
- OpenTSDB write and read daemons would go down
- One bad query would bring down the entire alerting system
In those12 months, we missed our weekly SLA 22 times.
We had a hunch on how we could solve this, but before jumping into building a solution, we decided to collect some data. This data would not only help us validate our assumptions but also give us confidence that the solution could work. Hence began the data collection mission.
Data Collection & Analysis
We added a bunch of instrumentation to our ingestion and query pipeline. We were in this data collection phase for about six months. The insights we got from this data were eye-opening. The data not only validated our assumptions but also planted seeds for another project, “Argus Downsampling,” which will reduce our Cost-To-Serve by 50%. But that is a topic for another blog post. So what did the data tell us?
- Only 0.7% of our metrics are used for alerting
- 99% of the alerts had a lookback window of fewer than six hours
This data gave us an idea: what if we store the alert-related metrics in an additional smaller HBase cluster and leverage the availability improvements provided by parallelly connected components? We were confident that if we shifted our architecture based on the following formula, it would solve the majority of our availability problems, if not all of them.
Availability of parallelly connected components:

Ax = Availability of component x
A = Final Availability
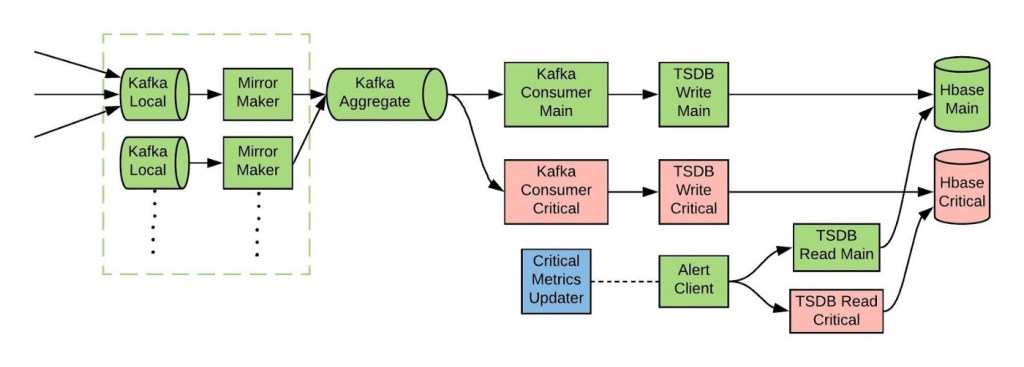
Therefore we came up with the following architecture:

Each component does the following jobs:
Critical-Metrics-Updater (CMU)
This component reads the alert definitions and creates a cache of critical metric names from it.
Kafka-Consumer-Critical
This component consumes all metrics from Kafka and forwards only the critical metrics to the rest of the ingestion pipeline. It drops non-critical metrics. Every five minutes, it pulls a list of critical metrics from the CMU.
Alert-Client (AC)
The alert client determines the health of each pipeline and, based on that, it decides which one to serve the alerts from.
What Problems Got Fixed
Ingestion Layer Problems:
We used to routinely see prolonged traffic spikes on some topics for various reasons. We also used to see Mirus replaying metrics due to offset resets. Both of these issues caused a backlog of metrics. These metrics were just sitting on Kafka waiting to be ingested into our metric store. This used to cause a lot of alert misfires. To mitigate this, we added some logic to disable the evaluation of alerts if the pipeline was not healthy. Neither of these was good for our customers. But with the new architecture, the critical metric pipeline processes this metric backlog very fast, since it is filtering out non-critical metrics. Therefore, we’re no longer getting alert misfires or flying blind. On average, we improved our backlog catch-up time from several hours to a few minutes.
Query Layer Problems:
Quite often, a query would come in which either had a long time range or contained too many time series in it. This would lock up our HBase region-servers. Because of this, not only did the query take too long to respond, locking up the read pipeline, but it also backed up the write pipeline. This was due to the same region-servers being responsible for both read and write traffic. Hence, our alert pipeline used to get affected by this.
With the new architecture, if something like the above happens, it only affects the non-critical cluster. The critical cluster remains healthy and our alert evaluation keeps running smoothly because the critical cluster is used to serve queries related to alert metrics. We also built in a validation layer to prevent misconfiguration of expensive alerts.
N + 1 Redundancy
The probability of both pipelines going down at the same exact time is much lower than one single pipeline going down. The good old mathematical formula from the telecommunications days came in handy and has saved us on many occasions.
SLA Improvement
This architecture has been running for over 10 months now and it has prevented SLA breaches on 10 occasions. This turned out to be very successful based on a simple mathematics formula and reduced hardware. YAY!
Takeaways
This project was a fantastic one that has paid huge dividends for us with very little hardware resources. It also taught us were some very good lessons:
Data Analysis and Usage Pattern
This has now become a routine design pattern for us. We are applying it to every major project we undertake. Always invest heavily in instrumentation from day one. This provides rich information about how customers are using your platform. We are tuning and evolving our platform to better suit our customer needs. By doing this step, we got very high confidence that the investment we were about to make in this project would result in a huge return on investment.
Get Scrappy

In a perfect world, you are given all the hardware resources you need to provide a High Availability (HA) solution. But that’s not always the case. In the absence of those resources, get scrappy, and work backward. If you only have 80 nodes instead of 450 and are being asked to add redundancy, then use that as a forcing function to innovate and find a solution.
Abstraction and Design Patterns
Given a problem in any domain, try to abstract out the problem by removing the specifics. If you succeed at this, you will realize that a solution exists by just applying well-known design patterns that the software industry has been using for decades in other domains. In our case, once we abstracted out, it became very clear that we can apply the N+1 design pattern that was used heavily in the telecommunications industry, which itself had taken that concept from aerospace, hardware control systems.
Conclusion
As the scale of our metrics platform continues growing, we are discovering new challenges and with it tremendous opportunities to solve them. It has been a fantastic ride for our team over the past four years. Handling the growing scale is one challenge, but developing time-series features on top of that scale is an even more interesting challenge. If working on something like this excites you, you can reach out to us on our careers page.
Acknowledgments
I did the architecture, design, and experimentation of this project. But it would not have been at all possible for it to be running successfully in production without the effort of a number of individuals. Chandravyas Annakula helped with the instrumentation. Dilip Devaraj did the implementation of the backend. Philip Liew did the implementation of the alerting logic. Kyle Lau worked through the infrastructure orchestration part. Atul Singh, Sujay Sahni, and Nishant Gupta provided fantastic technical feedback and helped with finding out the blind spots. Last but not least, Kirankumar Gowdru for his excellent leadership skills and successfully coordinating and executing this project.


