By Archana Kumari, Yushu Yao, and Priya Lal.
In our Engineering Energizers Q&A series, we highlight the engineering minds driving innovation across Salesforce. Today, we spotlight Archana Kumari, Director of Software Engineering, whose team built Agentforce Health Monitoring (AHM).
AHM is designed to help agent builders and operations managers detect production-agent availability problems, investigate incidents, and route alerts through their organizations’ operational workflows. AHM focuses on detecting silent availability failures, connecting alerts to relevant session context, and supporting configurable metrics and enterprise alert routing.
Explore how Archana’s team is closing critical monitoring gaps by detecting silent availability failures, connecting alerts to relevant session context, and creating a more actionable investigation experience for administrators.
What mission drove your team to build Agentforce Health Monitoring, and why does traditional monitoring fall short for production AI agents?
The mission is to close the trust gap created by deceptive “green” metrics. An agent can appear healthy even when a request never reaches it, an upstream connection fails, or an LLM gateway outage leaves it unresponsive. In those situations, conventional monitoring may not tell an operator that users are no longer receiving an end-to-end response.
AHM addresses that gap with an agent availability metric and automated alerting, built specifically to catch this “silent failure” case, alongside error rate, response/escalation rate, engagement, and latency across 16+ built-in metrics. Next up on the roadmap are cost, TTFT/TTLT, toxicity, and feedback metrics, plus deeper integration with RAG Quality Monitoring (RAGQM) for answer-quality signals. The goal overall is proactive visibility for agent guilders and ops managers, with a connected incident experience that moves them quickly from detection to the relevant session context.
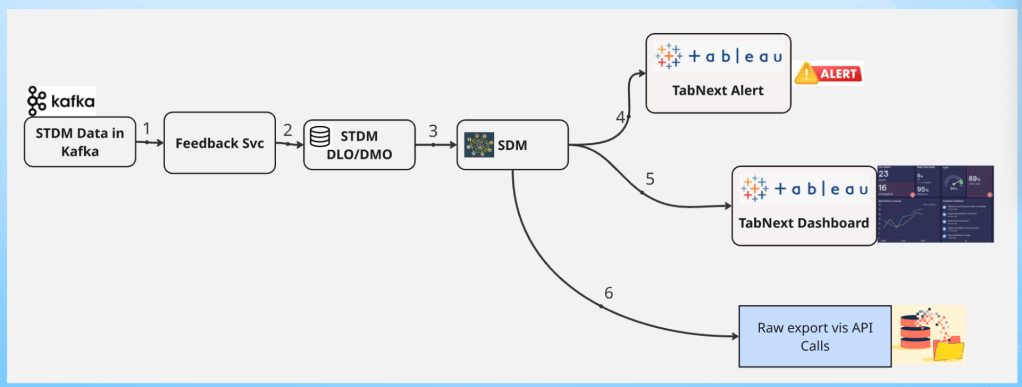
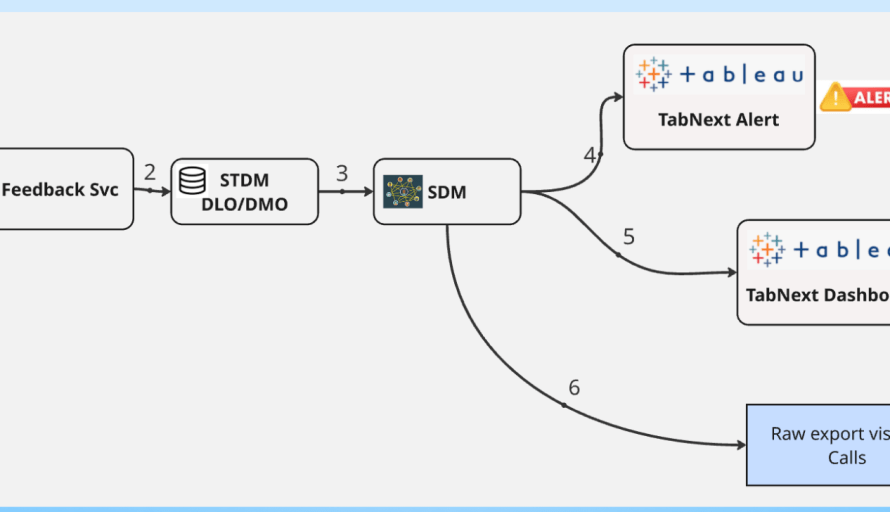
A look inside AHM’s architecture.
Why are AI agent hallucinations, context loss, and other silent failures so difficult to detect?
The first challenge was determining whether the team had enough of the right data to recognize an AI agent failure. Agentforce has many moving parts, with signals originating across sessions, reasoning steps, tool calls, responses, errors, and escalations. The team had to identify the necessary signals, verify that they accurately represented agent behavior, and ensure they arrived in a consistent form that AHM could evaluate.
Detection also varies by use case. AI agent hallucinations, context loss, poor grounding, elevated error rates, and unsuccessful escalations may each require different combinations of signals, while customers may define unacceptable behavior differently. To begin closing those detection gaps, the team worked with signal-producing teams and forward-deployed engineers to identify priority use cases and obtain the necessary source data in the correct shape. That work continues, particularly around hallucination detection, poor grounding, context loss, and end-to-end correlation.
What made unifying fragmented AI agent telemetry the hardest observability challenge?
An agent session can generate telemetry across interactions, reasoning steps, tool calls, errors, and escalations, with those data points fragmented across approximately five or six locations. No single event could always explain what happened, and no single system provided enough context to define a meaningful alert.
Solving that fragmentation problem required us to combine those signals into a coherent representation of the agent journey before deriving metrics for elevated error rates, excessive escalations, slow responses, or unresponsive agents. AHM also had to integrate across Salesforce’s large, distributed ecosystem while presenting one seamless AI agent monitoring experience to administrators. The hardest part was not creating an isolated alert, rather, it was connecting that alert to the context needed to understand it.
Why was reducing AI agent alerting latency from approximately 20 minutes so challenging?
Connecting the telemetry solved only part of the problem. Agents can emit events at sub-second intervals, but that data must travel through the ingestion pipeline and reach the alert-evaluation service before AHM can determine whether a metric crossed its threshold. Slow ingestion or evaluation could leave administrators unaware of a production AI agent failure while it continued affecting additional sessions.
Reducing that delay required changes across both ingestion and evaluation. The original end-to-end alerting latency was approximately 20 minutes, measured from the event that caused a metric to breach its threshold until the administrator received the alert. Data 360 ingestion was converted to streaming and query complexity was simplified so alert evaluations could run more frequently. Those optimizations reduced latency to several minutes as its north star investigation metric is under 120 seconds from clicking an alert or email link to viewing the relevant session page. That supports the current human response model, while future agent-driven responses will require movement closer to real-time AI agent monitoring.
Why does effective AI agent observability require actionable debugging information?
Faster AI agent monitoring still left another problem. Detection alone does not tell administrators which sessions failed, what happened inside them, or what they should do next. When hundreds of agents are serving thousands of customer interactions, administrators must move quickly from an alert to the affected sessions and isolate the step where the failure occurred. An alert identifies the symptom; administrators still need session-level context to diagnose the cause.
To connect detection with AI agent debugging, the team created a drill-down experience that lets administrators identify affected sessions and examine the steps and fields related to a failure. That context can reveal whether the underlying cause was incorrect context, an inadequate knowledge article, a failed tool call, a poorly designed flow, or another part of the agent workflow. Customers can also define their own metrics and alerts, such as identifying sessions that exceed a specified token threshold and investigating why. The goal is for every alert to support root-cause analysis instead of merely announcing a problem.
What challenges stand between AI agent monitoring and automated remediation?
Making alerts actionable establishes the foundation for AHM’s next challenge. The incident lifecycle progresses through four stages: detect, notify, diagnose, and fix. The current AI agent monitoring platform focuses on the first two, but customers also need help identifying root causes and eventually resolving failures. That includes cases in which an agent becomes unresponsive because an internal service, tool call, or configured flow failed underneath it.
To advance from AI agent debugging toward remediation, the team is exploring a runtime insight agent that could let administrators ask why an alert occurred, identify the root cause, and receive a recommended solution without manually reconstructing multiple sessions. The longer-term goal is automated remediation: detecting a failure, diagnosing it, recommending a response, and, with customer approval, applying the solution. The team is also considering agent heartbeats, retries, and human handoffs that preserve session context. The destination is an AI agent observability system that does not stop at detecting and reporting failures, but helps customers diagnose and ultimately resolve them.
Learn More
- Stay connected by joining our Talent Community.
- Explore our Technology and Product teams to see how you can get involved.