In our Engineering Energizers Q&A series, we highlight the engineering minds driving innovation across Salesforce. Today, we spotlight Kishore Chaganti, Principal Software Engineer on the Interactive Data Science team, who scales the Einstein Notebooking platform to provide secure, production-grade AI debugging for Data 360 and Agentforce. This empowers engineers to run investigations across more than 60 Agentforce features, with 600 users, and massive datasets exceeding 400 million records and 800 GB of data.
Explore how the team solved the challenge of opaque AI agent behavior by providing query-driven access to production data, slashing investigation times from two weeks to a single day through Spark-based workflows that expose document chunks, embeddings, and session-level feedback across Data 360 systems.
What is your team’s mission enabling production Agentforce AI debugging through Einstein Notebooking?
We build systems that enable engineers and data scientists to debug AI agents against actual production behavior. This approach allows teams to identify, reproduce, and analyze issues using real data and system interactions.
To make this possible, the team develops unified workflows that bridge the gap between data access, debugging, and validation. These tools empower data scientists and engineers to investigate production scenarios directly instead of relying on incomplete staging environments.
Such work requires full visibility across the entire AI pipeline, covering everything from ingestion and chunking to retrieval and response generation. By seeing every step, engineers finally understand exactly how the system forms its outputs.
The team also prioritizes secure, tenant-scoped access patterns to maintain strict data isolation and compliance during the debugging process. Together, these capabilities ensure that every investigation reflects actual system behavior rather than mere approximations.
What debugging constraints arise when Agentforce AI agents produce incorrect or unexpected responses in production environments?
Debugging incorrect AI responses in production remains difficult because engineers lack visibility into how the system generates specific answers. Without the ability to inspect retrieved document chunks or trace the retrieval process, teams struggle to identify if an issue stems from retrieval, chunking, or downstream processing.
Reproducing these failures adds another layer of complexity since staging environments lack production-specific data, embeddings, and tenant configurations. This gap prevents engineers from accurately replicating how the system behaves in a live environment. Furthermore, fragmented signals across logs and session data force teams to correlate information across multiple systems manually.
To solve these challenges, the team enabled direct query access to production data within a controlled environment. This shift allows engineers to inspect retrieved chunks and correlate session-level signals using real tenant data. By replacing manual processes with unified query workflows, the team now performs precise investigations into exactly how the system produces every response.
What limitations of logs and metrics made traditional observability insufficient for debugging Agentforce AI systems in production?
Logs and metrics offer a narrow view of system performance because they record final outputs while hiding the data used during execution. While logs track responses and metrics measure latency, neither reveals the specific information an agent consumes or how that data influences the result.
This lack of transparency stops engineers from investigating retrieval paths, document chunks, and embeddings for individual requests. Debugging then relies on indirect signals and slow access workflows, which hinders the validation of technical hypotheses.
The team solved this by introducing query-driven observability. Engineers now query production data directly to inspect the exact inputs used by the agent. This approach allows teams to trace response generation using the same data and query paths found in production systems.
What limitations in traditional observability made debugging AI behavior in production difficult, and how did query-driven observability improve it?
Traditional observability tools restrict engineers to static outputs and slow workflows, preventing interactive investigations of production behavior. Teams lack the ability to query what an agent sees for specific requests, tenants, or timeframes. Furthermore, fragmented signals across different Data 360 and Agentforce foundation services make end-to-end analysis difficult because retrieval, embedding, and generation data reside in separate systems.
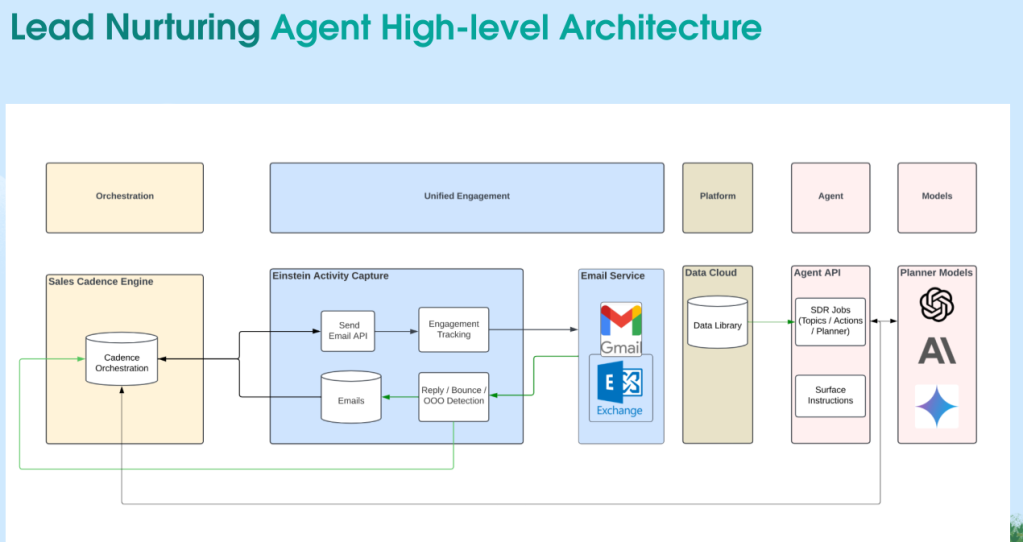
The team designed a solution to unify access while maintaining performance and security. This system enables direct querying of production indexes, including vector, keyword, and hybrid search, using the actual Data 360 objects that drive agent behavior. Engineers now inspect document chunks, embeddings, and retrieval results within one workflow.
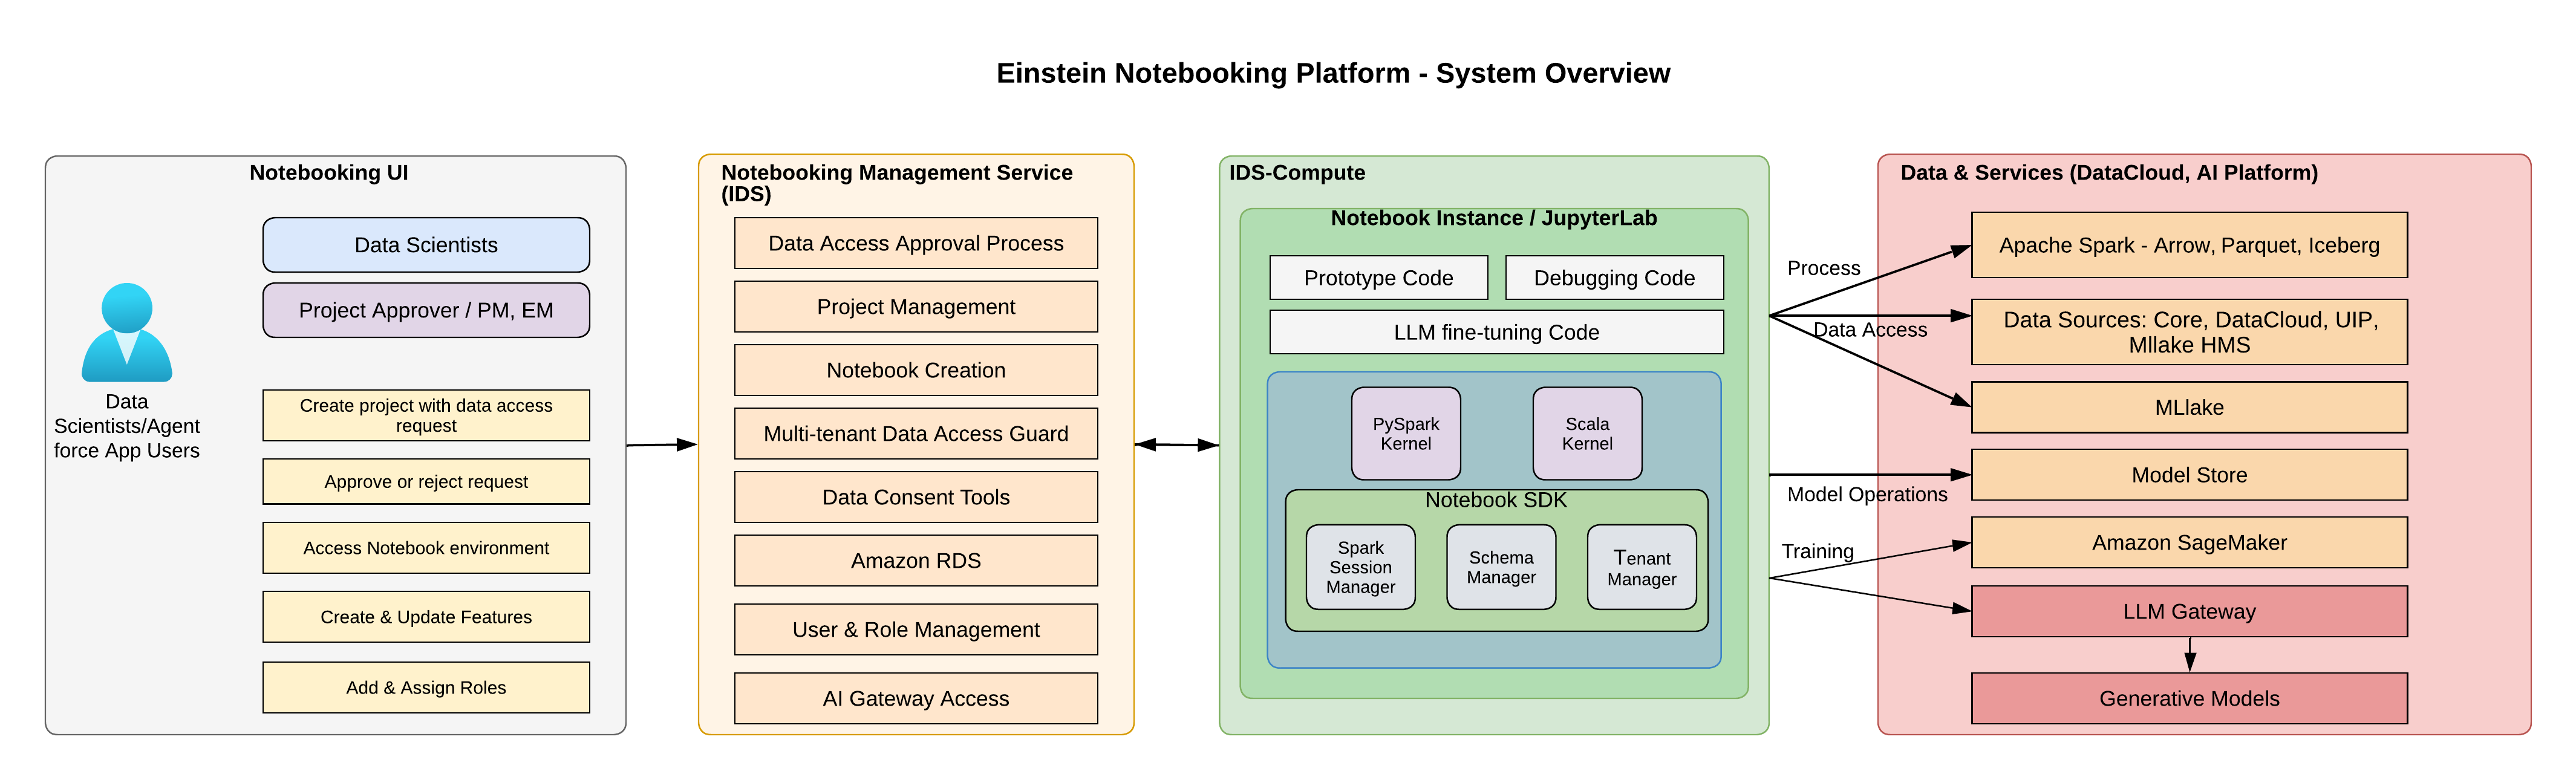
The Notebooking Platform uses a Spark DataFrame interface to support large-scale investigations in a notebook environment. Engineers run queries, inspect results, and validate behavior using production data in a single, streamlined process.
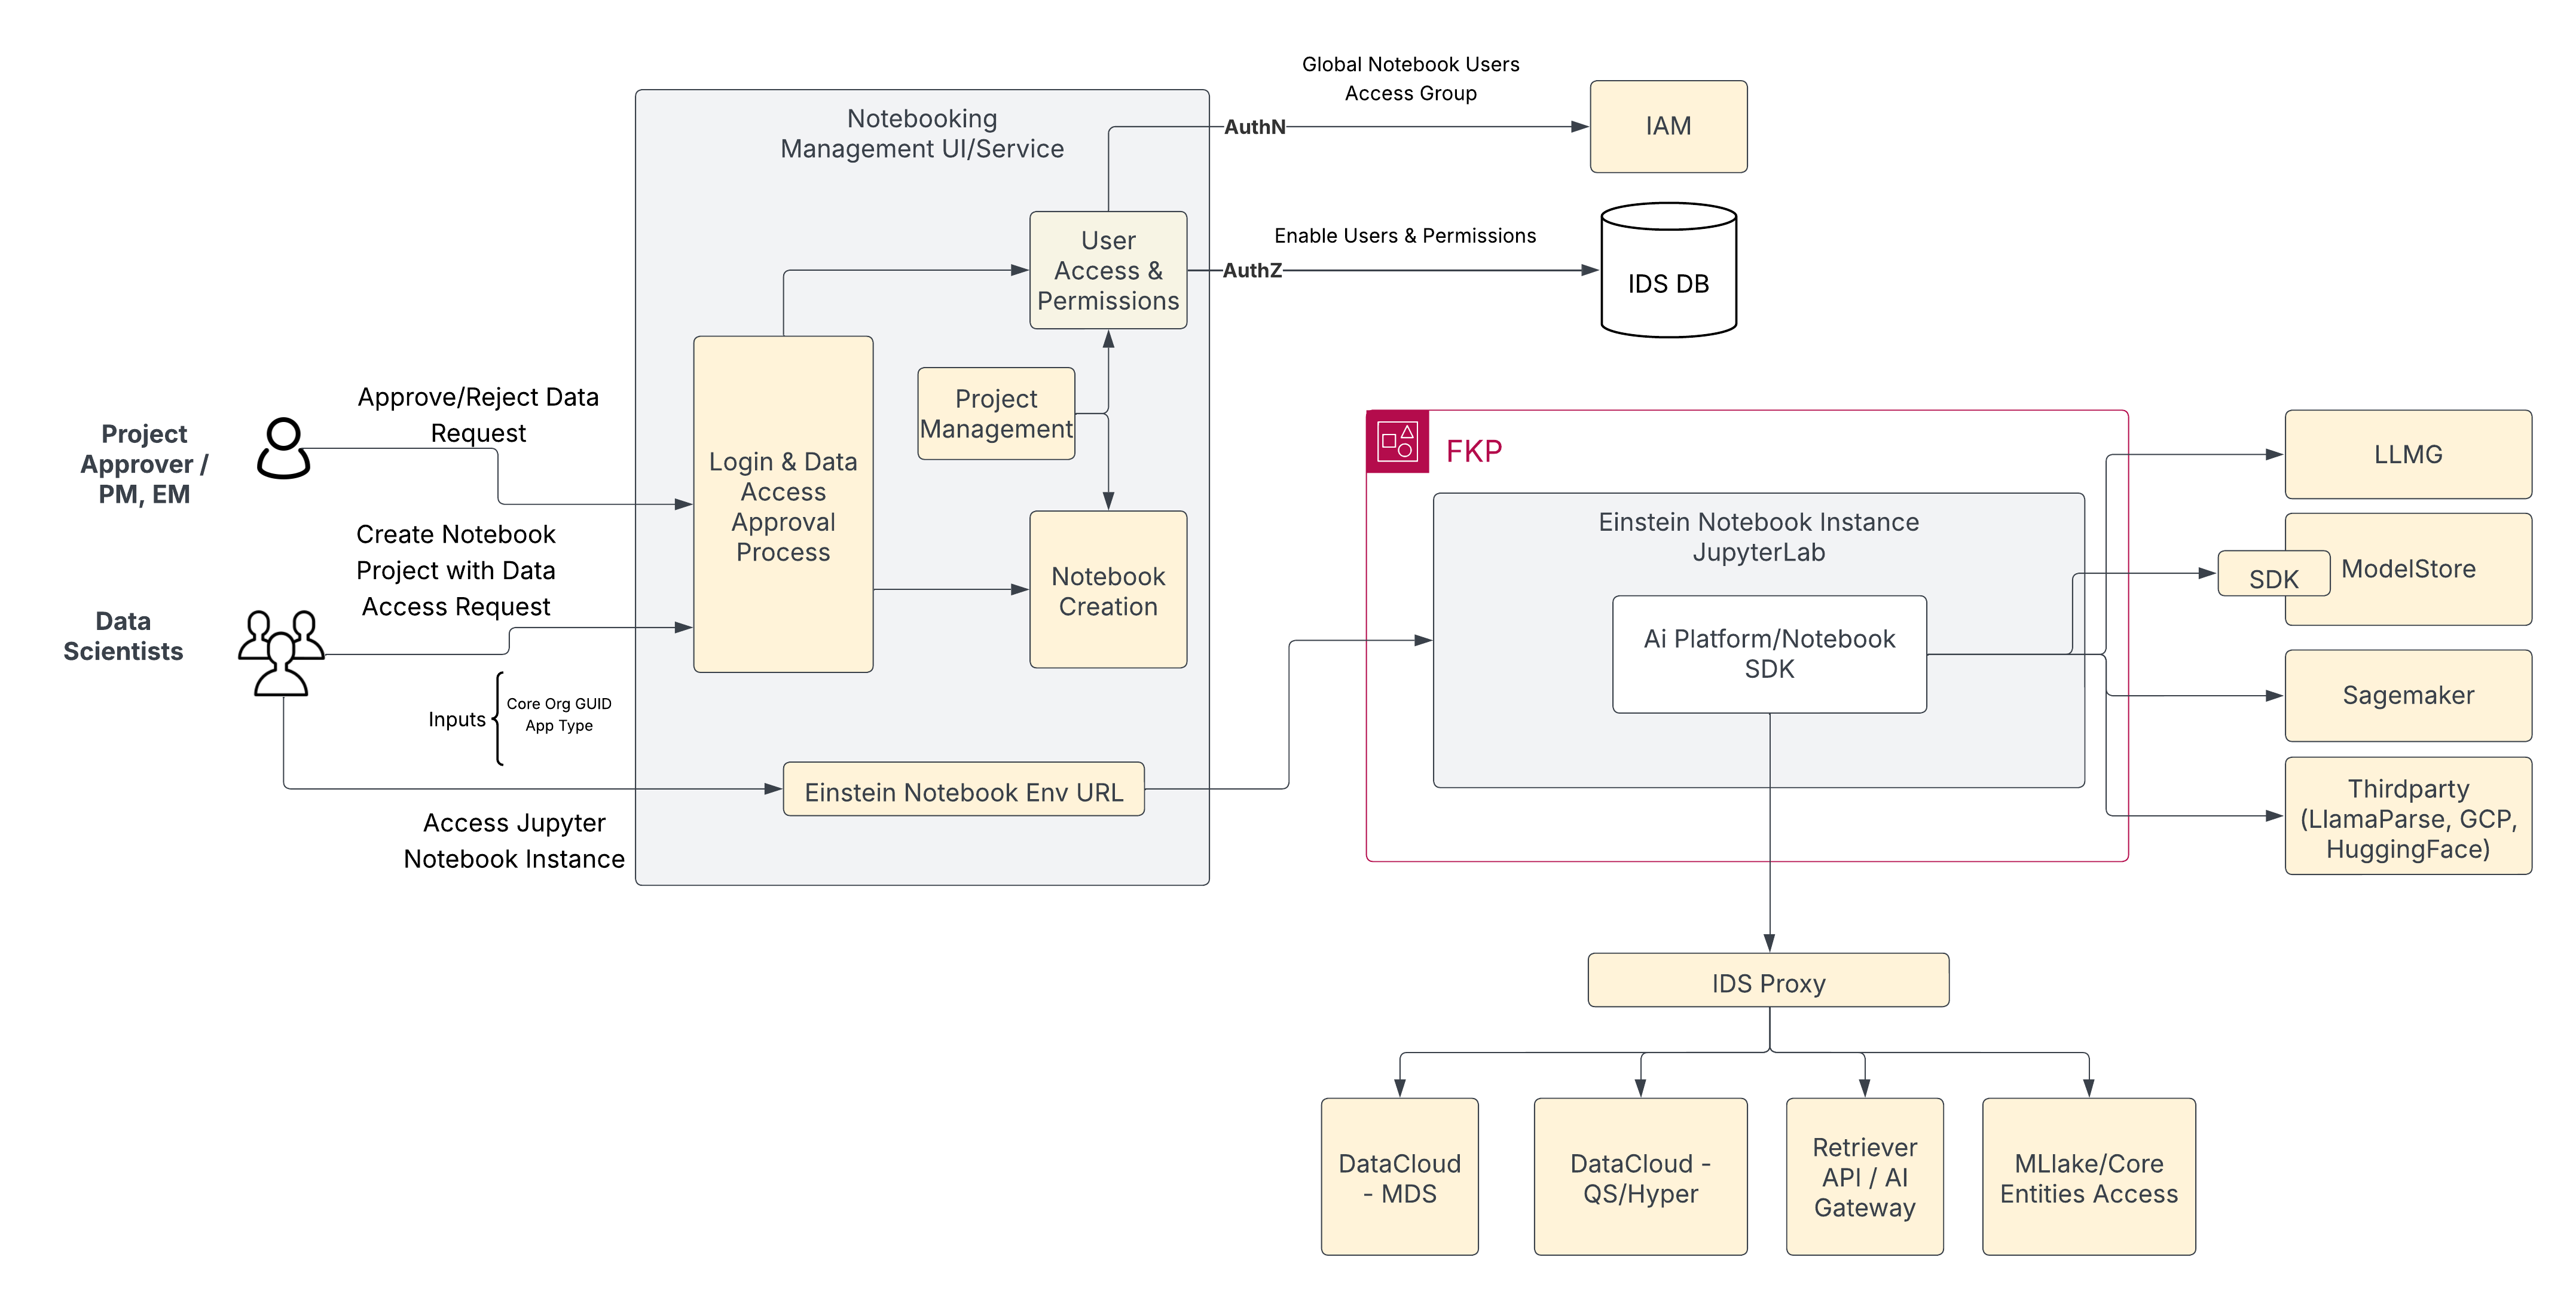
Notebooking architecture components.
What development workflow constraints limited debugging and iteration speed in Agent RAG systems, and how did you address them?
Engineers face limited visibility into document transformations across the RAG pipeline, including ingestion, chunking, and retrieval. This lack of transparency makes inspecting production chunking difficult. Structured data like nested tables presents a particular challenge, where errors produce garbled context for the LLM and change the information’s meaning.
A slow, multi-stage “outer loop” workflow compounded these challenges. Shipping a single change required creating and merging PRs across three to four repositories, managing deployments across multiple pipelines, and verifying execution through system logs. This process forced engineers through roughly 10 manual steps for even minor fixes. Reproducing issues like incorrect answers from flawed chunk representations required rebuilding pipelines and waiting for full deployment cycles. Consequently, small quality fixes took at least two weeks to reach customers.
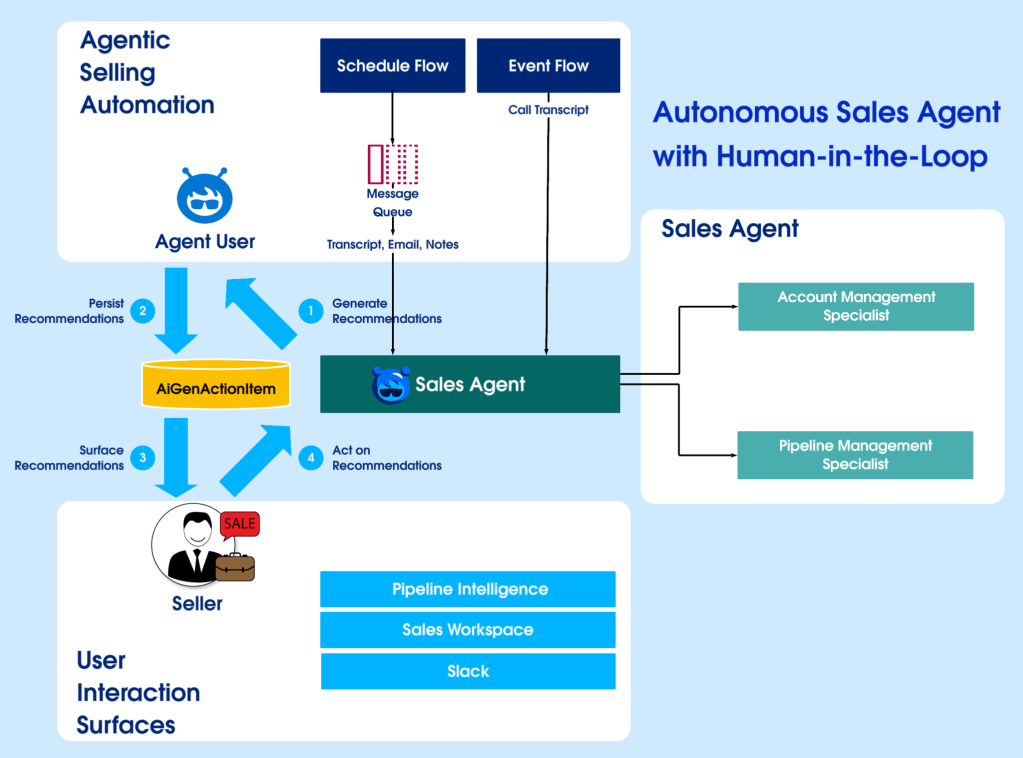
To address this, the team introduced a notebook-based inner loop that enables direct interaction with production data and RAG components. Engineers now query existing chunks, retrieve source documents, and re-parse them using tools like LlamaParse. They also generate new embeddings and re-run queries within the same environment. This system allows the validation of chunking and retrieval behavior directly against production data without relying on multi-stage deployment pipelines.
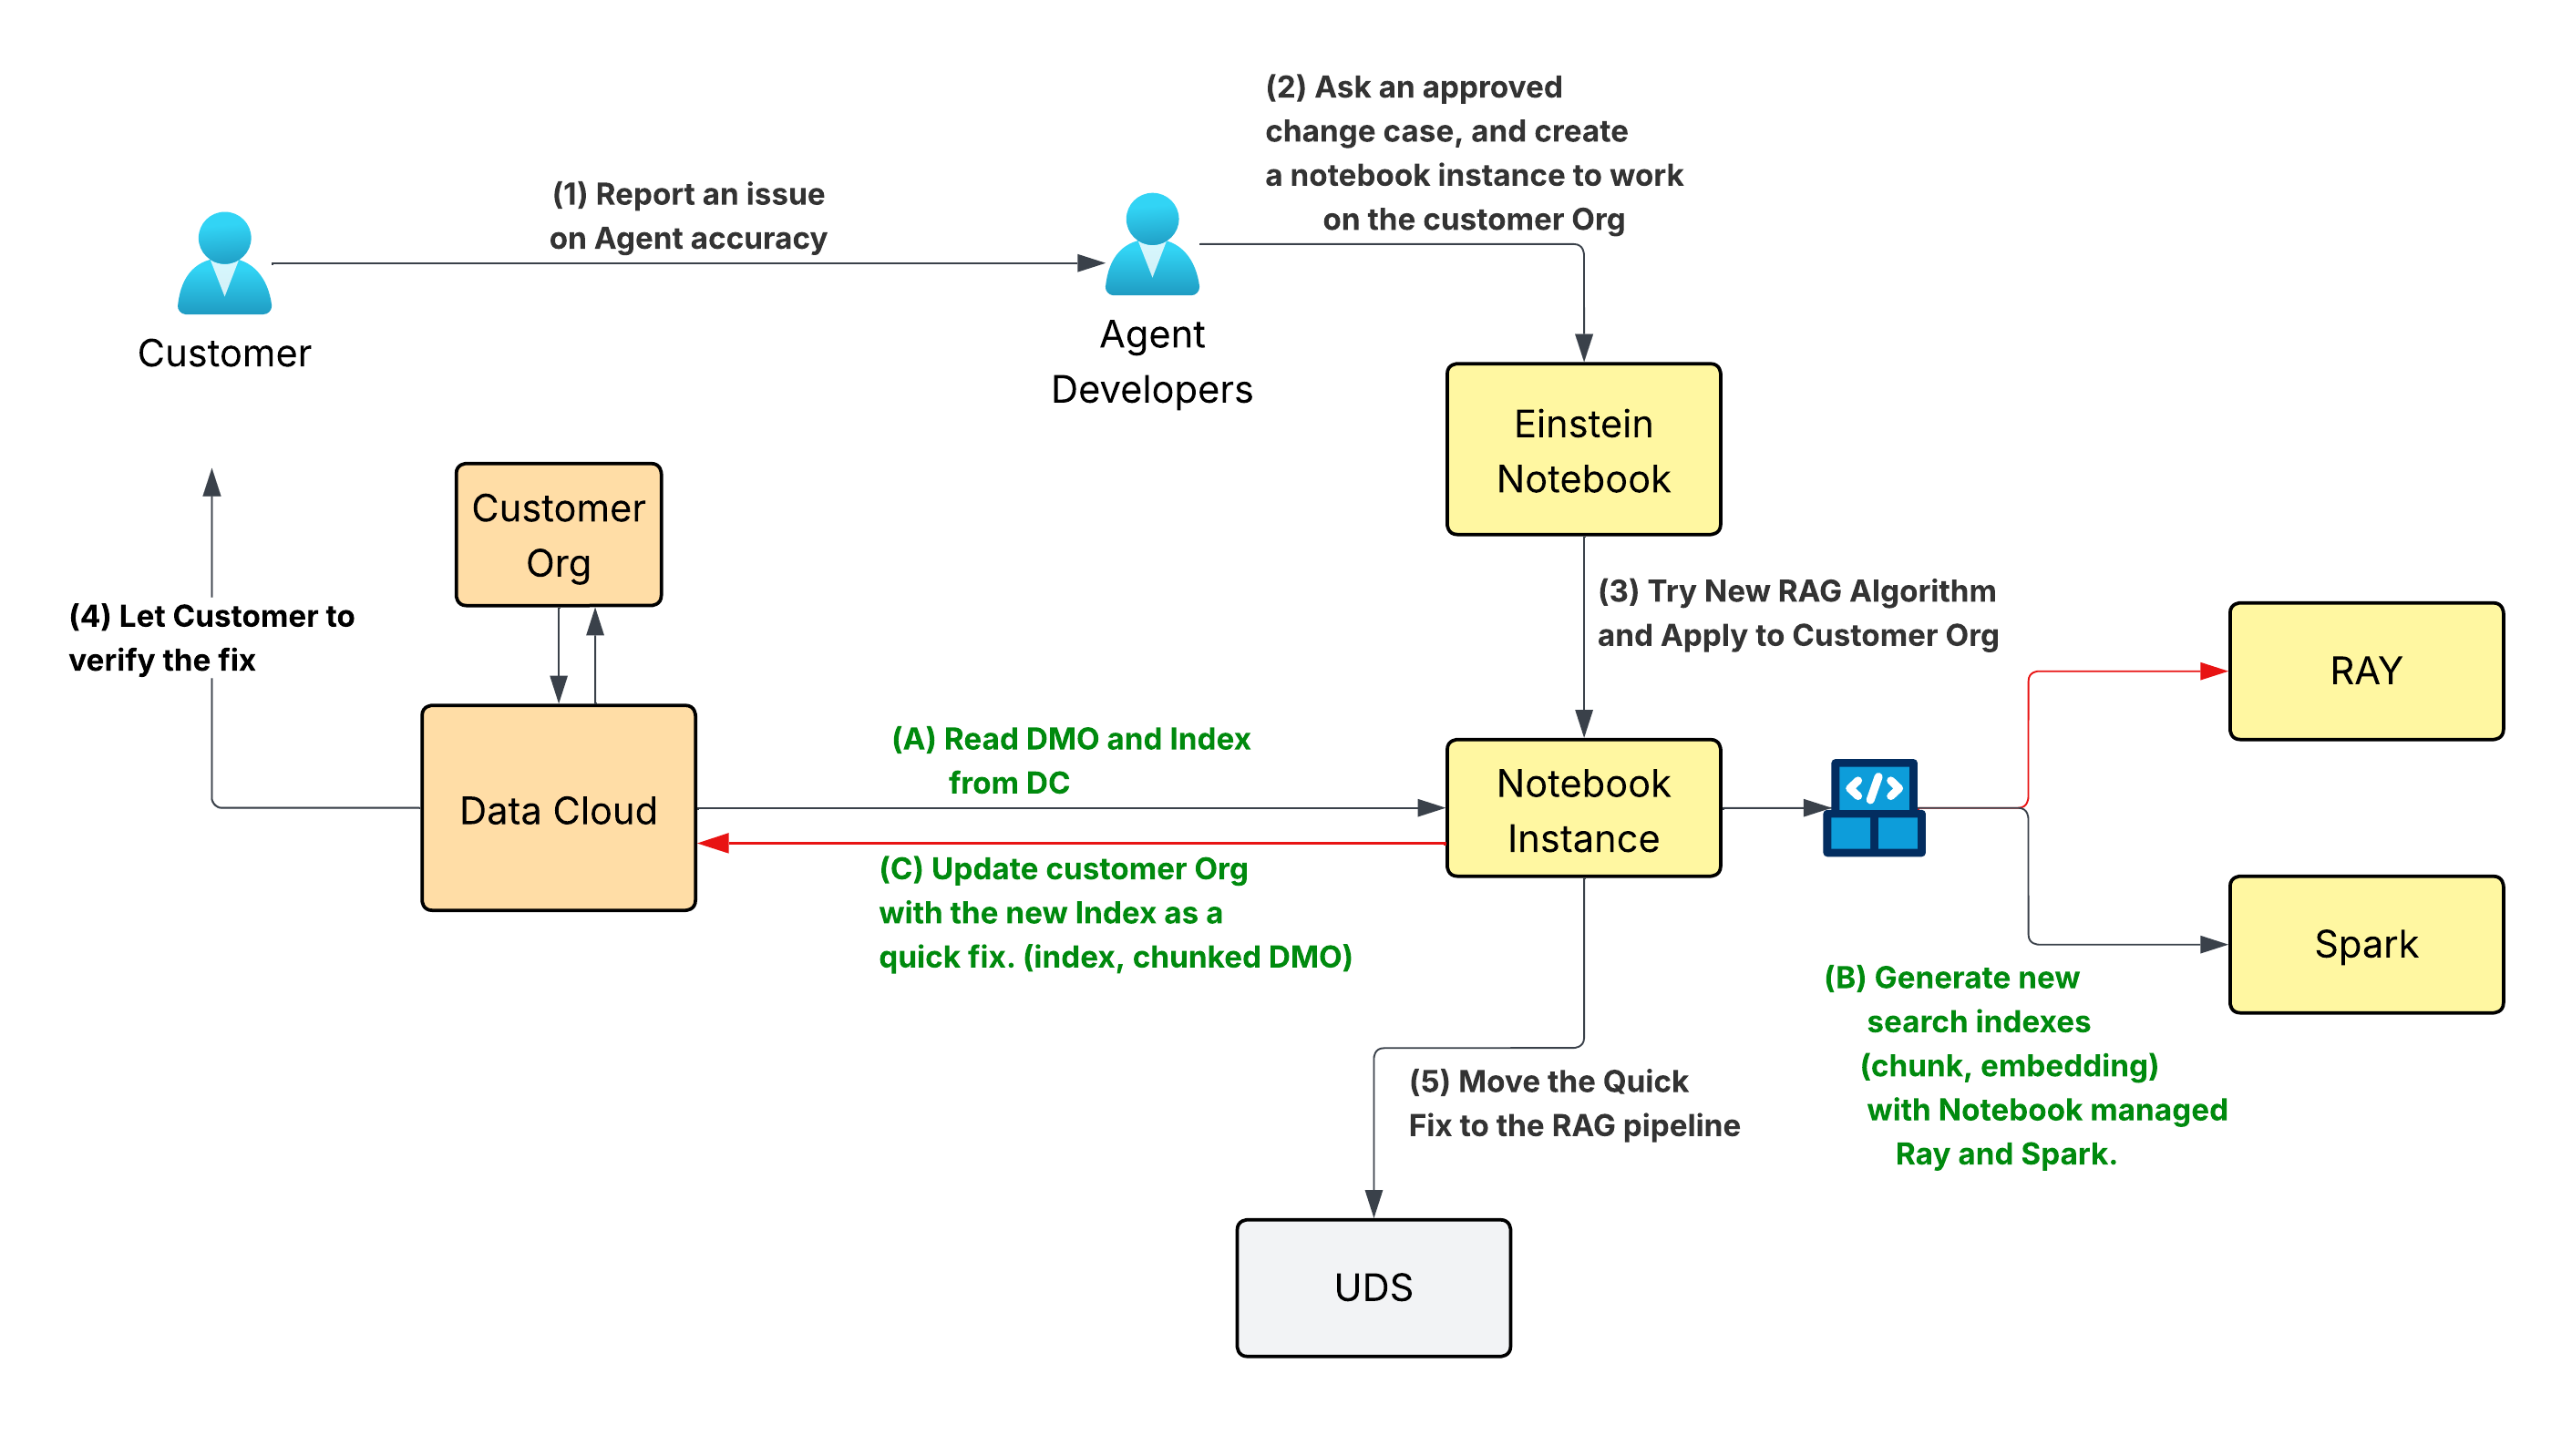
Inner Loop with Notebooking: Interactive workflow.
What challenges arise when debugging RAG workflows such as retrieval, chunking, and document processing in production?
Engineers face limited visibility into document transformations across the RAG pipeline, including ingestion, chunking, and retrieval. This makes inspecting production chunking difficult, especially for structured data like nested tables where it yielding garbled context for the LLM which cause errors change the meaning of the information. Additionally, traditional workflows prevent experimentation because they require pipeline changes and redeployments before engineers can validate new strategies.
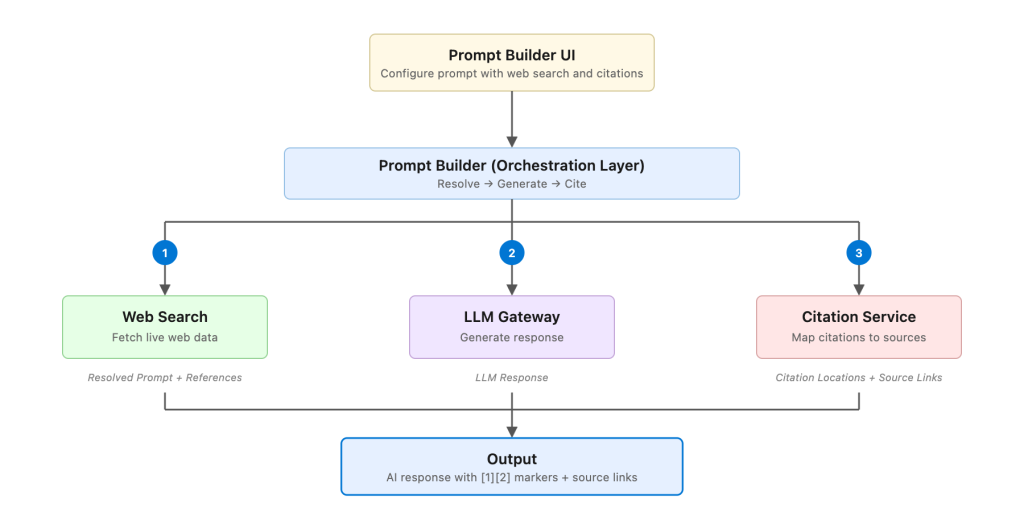
The team created a unified RAG debugging workflow to solve these issues. Engineers now query existing chunks and retrieve source documents directly. The system allows users to re-parse documents with tools like LlamaParse, generate new embeddings, and re-run queries in one environment. This process enables engineers to compare chunking strategies and validate their impact on retrieval using production data.
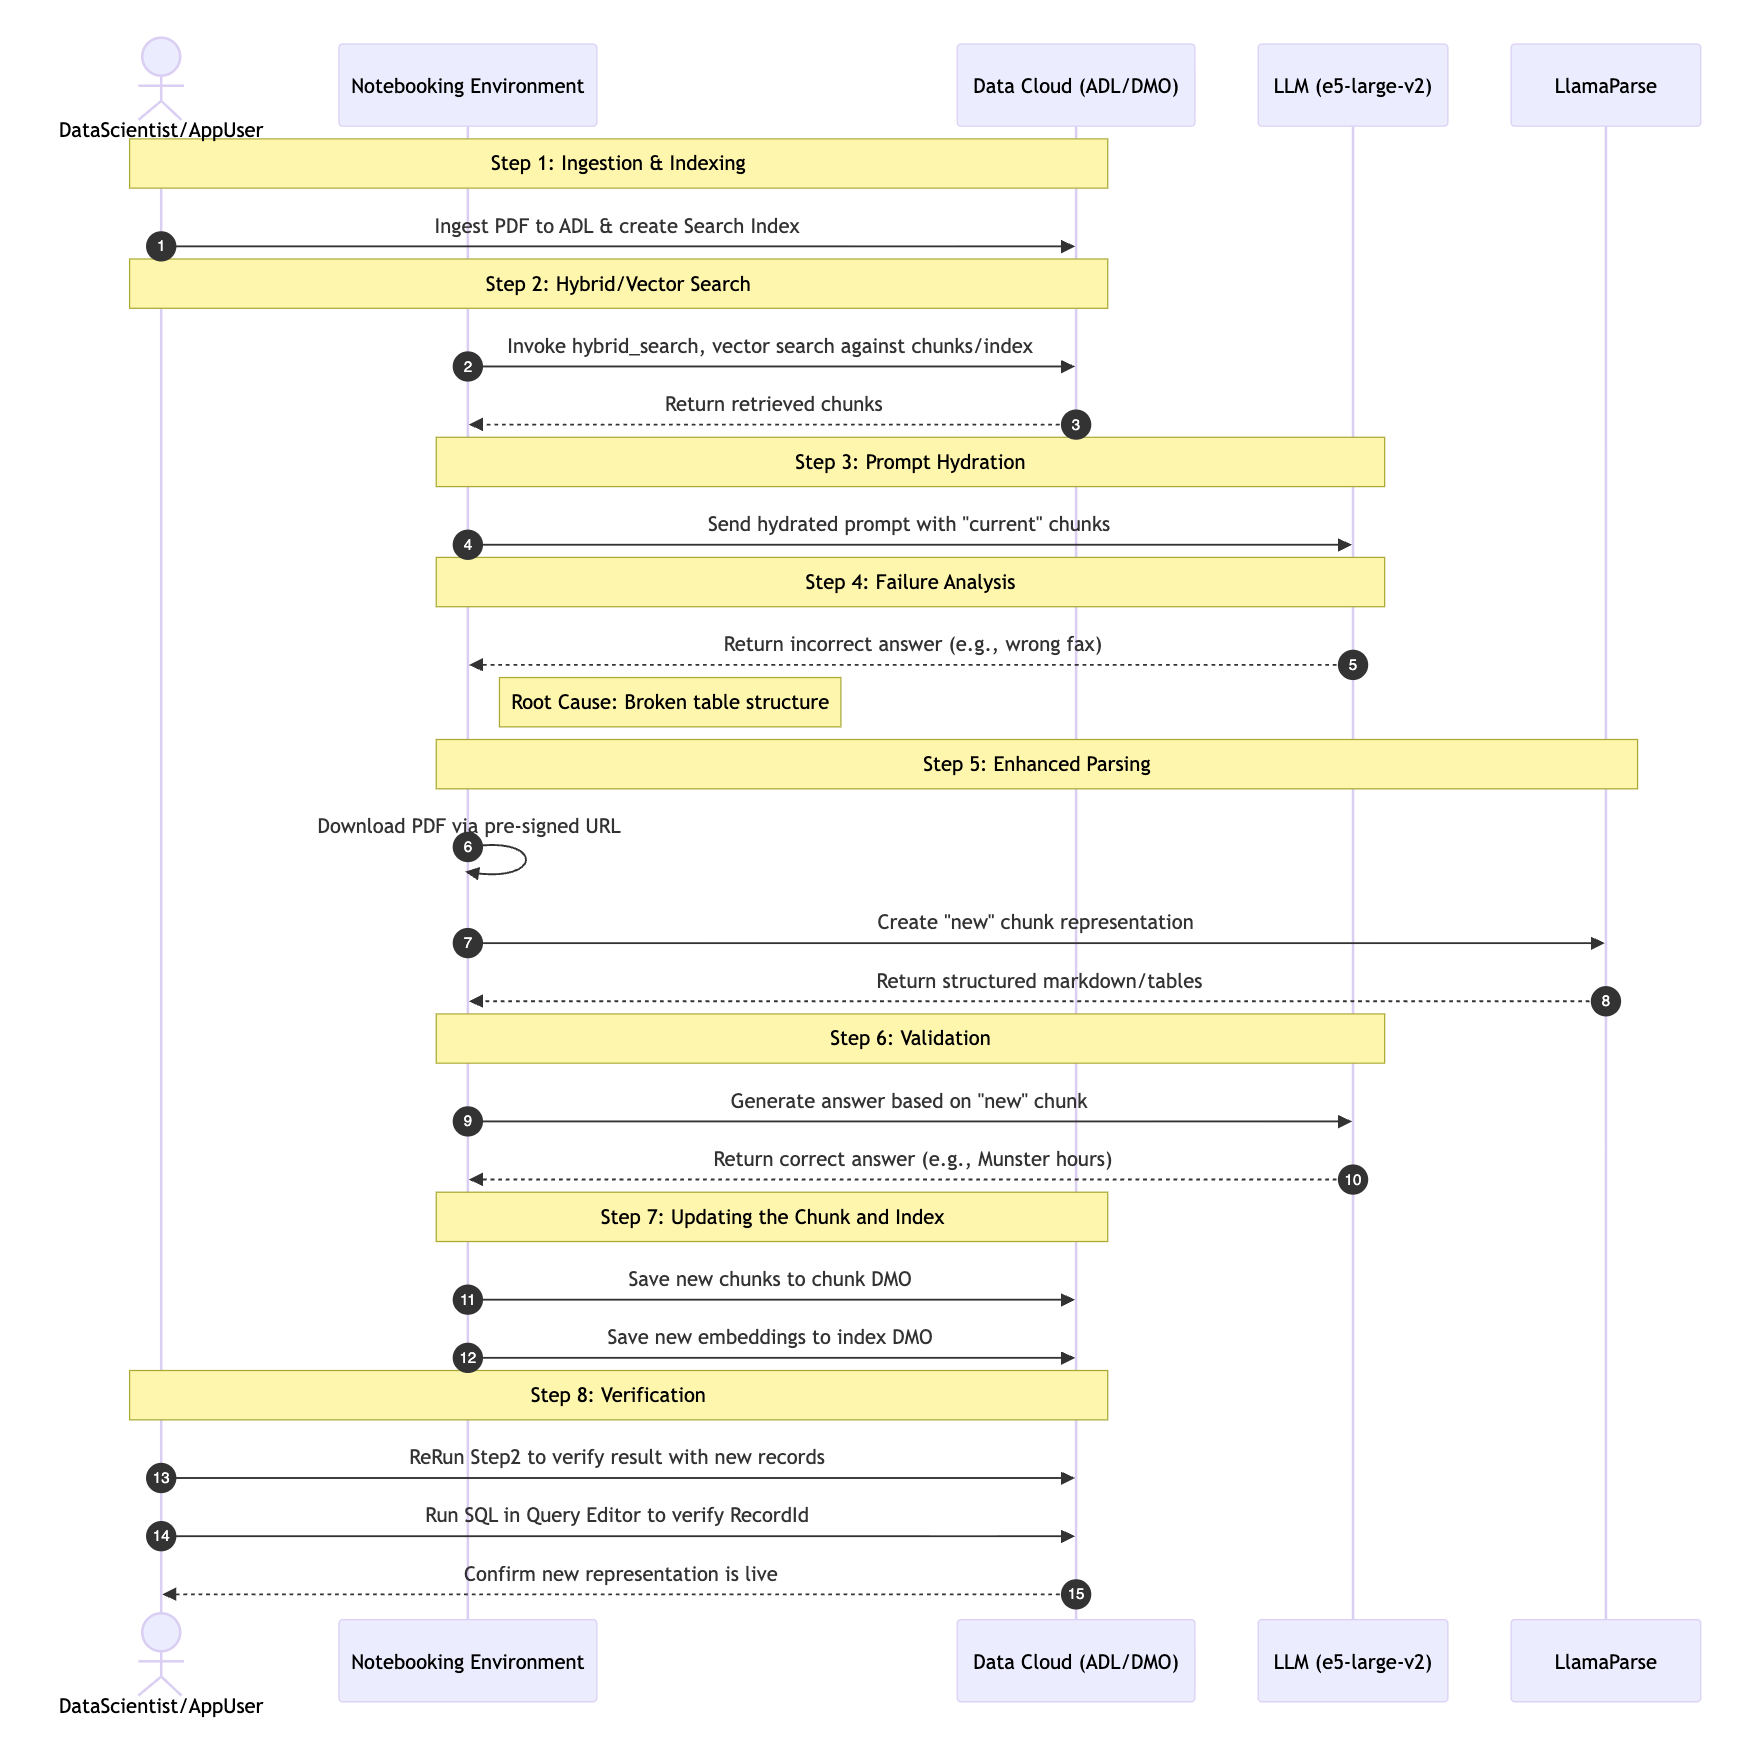
Agent (RAG) debugging workflow.
What security, multi-tenant, and scalability constraints shaped how you enabled query-driven debugging against production data?
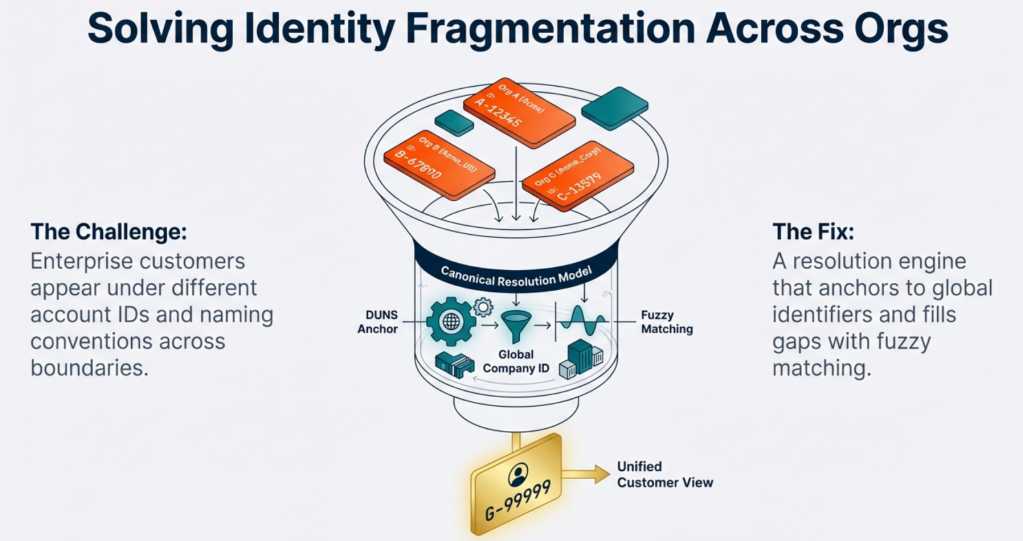
Debugging production data requires strict security measures to protect sensitive information and maintain tenant isolation. Engineers must investigate system behavior without bypassing compliance controls or exposing data across different tenants. The system also needs to manage large-scale investigations across distributed datasets while maintaining performance.
The team developed a multi-layered architecture to address these security and scale requirements. This framework uses IAM-backed access, mutual TLS, and fine-grained permissions to enforce isolation. Notebooks run in tenant-scoped contexts by default, and the system audits all activity.
A gRPC gateway standardizes authentication and connects distributed compute services with unified data and AI services. Spark-based processing and high-performance data formats support large-scale queries. Sandbox-first write-back mechanisms allow for controlled experimentation. This architecture lets engineers analyze production behavior at scale while maintaining security and compliance.
Learn more
- Stay connected — join our Talent Community!
- Check out our Technology and Product teams to learn how you can get involved.