In our “Engineering Energizers” Q&A series, we highlight the brilliant engineering minds behind Salesforce’s innovations. Today, we feature Lakshmi Dontamsetti, Senior Manager of Software Engineering for Mobile Performance. Lakshmi and her team automated the migration of 20 production monitoring dashboards from Splunk to Tableau using Cursor and MCP Server, reducing engineering time by 75% while maintaining 99% production availability.
Explore how the team addressed time series translation issues, where Splunk’s automatic bucketing had no direct SQL equivalent, navigated schema mapping complexities by explicitly defining table and column names across distributed query engines, trained AI tools to distinguish between query translation and aggregation logic.
What is your team’s mission building production monitoring dashboards for Salesforce mobile applications?
Our Mobile Performance Engineering team is committed to delivering top-tier enterprise mobile platforms and applications, with a focus on world-class performance and robust production monitoring. Our core mission is to proactively identify and resolve mobile health and performance issues, ensuring that our production monitoring systems achieve 99% availability.
To accomplish this, we leverage advanced visualization tools such as Splunk, Tableau, and Grafana. These tools provide a comprehensive view of the mobile ecosystem, enabling us to monitor and optimize performance in real-time. Without a robust observability infrastructure, we would lose critical real-time visibility, leading to delayed issue detection, longer resolution times, and a negative customer experience. Slow load times, application crashes, and unresponsive interfaces can erode trust and impact customer satisfaction. Therefore, robust production monitoring is not just a technical necessity; it is essential for maintaining customer trust and ensuring the integrity of our organization.
What productivity crisis emerged when Splunk was sunsetted with tight migration deadlines?
Given the sudden announcement of Splunk’s sunset, we needed to quickly back up the Splunk dashboards to preserve the queries used in their construction and rebuild the associated dashboards. Each dashboard contained an average of 10 to 15 panels, requiring us to back up approximately 240 queries across 20 dashboards. This was a significant challenge, as the work was unplanned and not part of our release schedule, with the team estimating it would take at least two sprints to complete manually.
The process was labor-intensive and prone to errors. Creating Tableau dashboards involves several steps, such as writing UIP queries, generating Tableau data sources using jobs, and developing Tableau worksheets and dashboards. Each step required expert oversight to accurately interpret the dashboards, panels, and queries. Traditional scripting and manual automation methods were inadequate for the scale and complexity of the task, leading us to explore AI tools like Cursor and MCP server for efficient dashboard migration.
What technical challenges did AI tools face translating Splunk time series queries to SQL?
Time series aggregation translation presented the most significant challenge. Splunk’s timechart and automatic time-bucketing have no direct SQL equivalent, necessitating the use of explicit DATE_TRUNC functions and window functions with timezone handling. Schema mapping was another hurdle, as Splunk dynamically extracts fields from logs, while SQL requires exact table and column names upfront. This necessitated a mapping layer between Splunk field names and actual Trino schemas.
The aggregation strategy added further complexity, as Splunk chains multiple statistical operations. The system had to strip out analytics like percentiles and counts while preserving filters to return raw table data. Date range handling required translating Splunk’s relative time syntax, such as earliest=-7d@d, into parameterized SQL date filters that support daily DAG runs and flexible dashboard time ranges. For dashboards with panels querying multiple LogRecordTypes, the tool needed to assign weights and create mapping rules to ensure accurate datasource queries.
Addressing these translation challenges required iterative prompt engineering to teach AI tools the difference between syntax conversion and semantic intent. This ensured that the AI tools could effectively handle the nuances of the data and provide reliable, accurate translations.
How did iterative prompt engineering solve Splunk-to-SQL translation challenges in Cursor?
The primary challenge was teaching the system to distinguish between what to translate and what to strip out from Splunk queries. Initially, the prompts generated SQL with complex aggregations and percentile calculations, but we needed only raw table data for flexible downstream analysis in Tableau.
We iterated through three key refinements to address this:
- Explicit User Rules: We added clear guidelines instructing the system to include only raw table data, without any percentiles, aggregations, or summary statistics — just unaggregated rows.
- Schema Mapping Document: We created a schema mapping document that the MCP server could reference for field-to-column translations, eliminating ambiguity in table and column names.
- Standardized Date Filter Patterns: We established rules for date filter patterns, such as always using
ts_datefor date-related queries, to ensure consistent time-range handling.
These iterative improvements transformed the initial AI outputs, which were syntactically correct but semantically wrong, into queries that precisely met the team’s analytical needs.
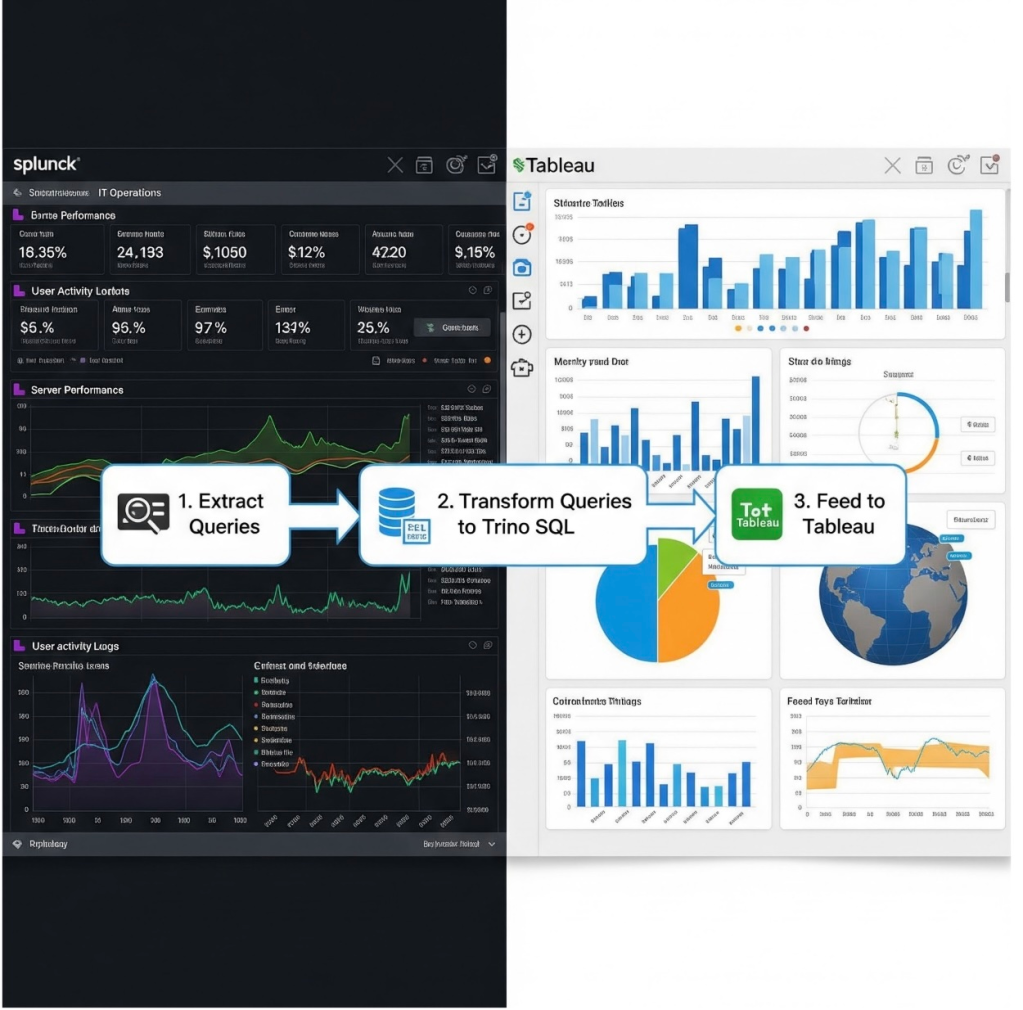
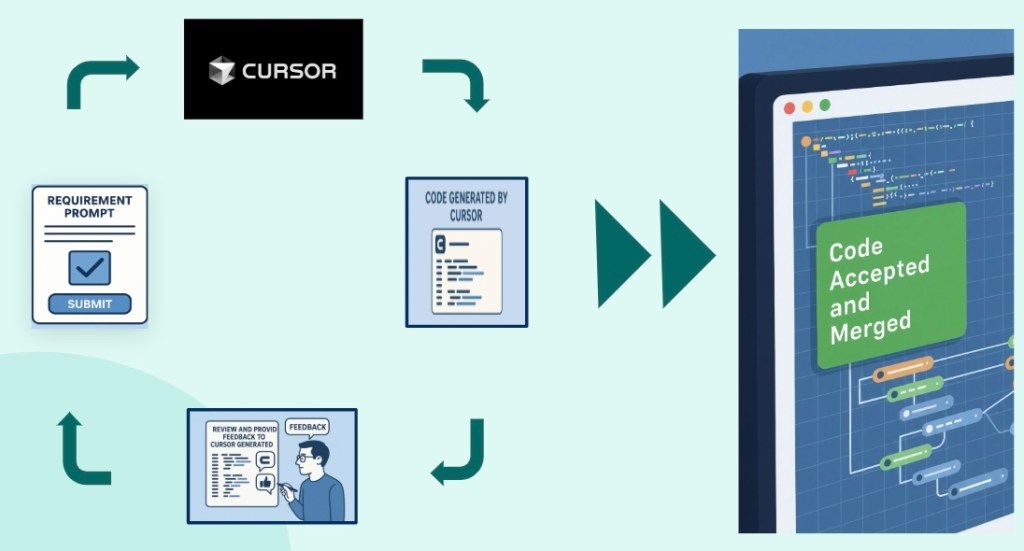
From diverse Splunk dashboards to Tableau: Accelerating migration with Cursor.
How did you verify AI-generated SQL accuracy without manual review eliminating productivity gains?
The goal was to use strategic manual validation to catch issues early, rather than conducting a comprehensive review that would eliminate productivity gains. We ran Splunk and Trino queries side-by-side for sample time periods, comparing row counts and key metrics to flag discrepancies that exceeded acceptable thresholds. The team monitored DAG runs to detect anomalies in row count and date range.
For automated datasource mapping during Tableau dashboard creation, we generated confidence scores for each panel. These scores were calculated by assigning weights to text pattern searches, panel section context, and LogRecordType compatibility. The tool generated Tableau workbooks locally for verification before automated cloud deployment.
Approximately 20 to 30 percent of the migration required human oversight in two key areas:
- Complex Business Logic Validation: Queries with custom calculations or domain-specific thresholds needed manual verification to ensure semantic correctness beyond syntax.
- Aggregation Strategy Decisions: Determining whether to pre-aggregate data in Trino or keep it raw for Tableau required an understanding of performance trade-offs that the AI couldn’t infer.
What scalability challenges emerged migrating 20+ Splunk dashboards to Tableau with AI assistance?
The main productivity bottleneck shifted from writing SQL to validating business logic, designing aggregation strategies, and determining the actual requirements. The complexity of dashboards varied widely. Simple dashboards, which tracked metrics like MAU, DAU, and time range EPT, migrated smoothly. In contrast, more complex dashboards with multi-step transformations and native variables required significant manual intervention.
Our approach was to start with the simpler panels to build confidence and then move on to the more complex ones, which involved nested subqueries and iterative prompt refinement. We intentionally left a couple of lower-priority dashboards un-migrated, but we completed backups in case they needed to be migrated later. This staged approach helped the team gain expertise with AI tools on simpler migrations before taking on the more complex, architecturally demanding monitoring dashboards.
What productivity gains beyond 75% time savings proved most valuable to your engineering team?
The integration of AI tools significantly enhanced team confidence and adoption rates, signaling a successful transition to AI-driven workflows. Engineers were pleased that AI took over repetitive tasks, allowing them to focus on critical thinking and reducing after-hours work.
More importantly, the freed-up engineering capacity enabled innovations that were previously unattainable. The team adopted a shift-left strategy for AI adoption, dedicating more time to Q4 MCP Server and conducting deeper performance testing that wasn’t feasible before, thereby identifying issues proactively. We developed innovative approaches such as spec-driven development and spec-driven dashboards, created preventive dashboards to detect production issues before they affected customers, and adopted distributed tracing with service dependency graphs and high-cardinality telemetry through Tracer. The team also expanded their outreach capabilities and performed more detailed feature profiling, fundamentally transforming their role from reactive migration work to proactive performance engineering.
Learn more
- Stay connected — join our Talent Community!
- Check out our Technology and Product teams to learn how you can get involved.