In our “Engineering Energizers” Q&A series, we highlight the engineering minds driving innovation across Salesforce. Today, we feature Monika Mulani, a performance engineer on the Experience Services Performance (ESP) team, who have reinvented their process for handling database bottlenecks, writing test scripts, and sharing complex technical knowledge using AI-driven productivity tools and automated performance testing solutions.
Discover how the team tackled time-consuming manual analysis, utilized AI-powered debugging tools to rewrite unfamiliar testing frameworks, and developed custom tools that make database performance analysis user-friendly for non-specialists. These efforts have expanded the team’s scope and achieved a 75% reduction in load generator compute requirements, optimizing infrastructure costs.
What is the team’s mission as it relates to performance engineering in Salesforce’s AI App Dev cloud?
Our team plays a crucial role in supporting multiple Scrum teams developing features across our AI App Dev cloud. Their mission is to ensure that both frontend and backend systems meet high performance standards. When development teams bring requirements such as supporting 3,000 requests per second, the ESP team steps in to conduct comprehensive testing. This process helps identify breaking points and bottlenecks, ensuring that systems can handle the expected load.
The team performs detailed analysis to verify that systems achieve the required throughput and response times. They closely monitor critical metrics, such as database CPU utilization, which should ideally remain around 5-7% to avoid spiking to problematic levels like 15%. Beyond just load testing, the team also identifies opportunities for performance optimization. This includes detecting issues such as SQL locks, deadlocks, and contention problems, ensuring that customer-facing systems can handle real-world traffic without any degradation.
This work is essential for maintaining a seamless customer experience. Performance regressions can lead to significant delays and system issues, especially when the platform is under heavy load. By proactively addressing these challenges, the ESP team helps ensure that end-users enjoy a reliable and efficient service, reinforcing Salesforce’s commitment to excellence.
What manual analysis bottlenecks were slowing down performance troubleshooting — and how did AI cut diagnosis time from hours to minutes?
Performance engineers at Salesforce often grapple with significant productivity hurdles when it comes to analyzing application logs in Splunk. The manual process of reviewing logs and interpreting performance data can be incredibly time-consuming, often requiring engineers to sift through hundreds of SQL calls to pinpoint optimization opportunities. For complex test scenarios, this could take hours, draining valuable engineering resources.
A critical turning point occurred during a performance regression where the team was unable to meet the target of 3,000 requests per second. Recognizing the need for a more efficient solution, the team decided to leverage Cursor with Claude, an AI-driven tool. This process began by exporting the raw performance data into a CSV format, which the AI could then analyze in parallel. This approach was a game-changer, as the AI quickly identified a caching opportunity that had been overlooked in manual reviews. It detected that the system was unnecessarily fetching a static organizational value multiple times, sometimes up to a million times during testing.
The impact of this technological shift was profound. What once took hours of manual log analysis is now resolved in 30 minutes or less. Engineers can now export data, engage with AI agents, and receive precise guidance on where to focus their efforts. This not only speeds up the troubleshooting process but also ensures that the necessary manual oversight is maintained for production systems, allowing the team to address critical issues more efficiently and effectively.
Monika explains what keeps her at Salesforce.
What database performance expertise barriers were preventing analysis by non-specialists — and how did AI democratize complex technical skills?
Performance monitoring across enterprise systems has highlighted that analyzing the performance of the Salesforce database (SDB) is one of the most challenging technical areas in performance engineering. This specialization poses significant barriers for many engineering teams. While most performance engineers can handle high-level analysis and spot general issues, database-specific problems require a deep understanding of database architecture, query optimization, and SDB-specific patterns — knowledge that even many seasoned performance engineers often lack.
This expertise gap is particularly pronounced when it comes to analyzing SQL trace files. Engineers frequently struggle to read and interpret these files, making it hard to determine if performance metrics are within acceptable ranges or if they indicate underlying issues. As a result, when database performance problems arise — often the root cause of broader system performance issues — most engineering teams must rely on specialized database administrators for help.
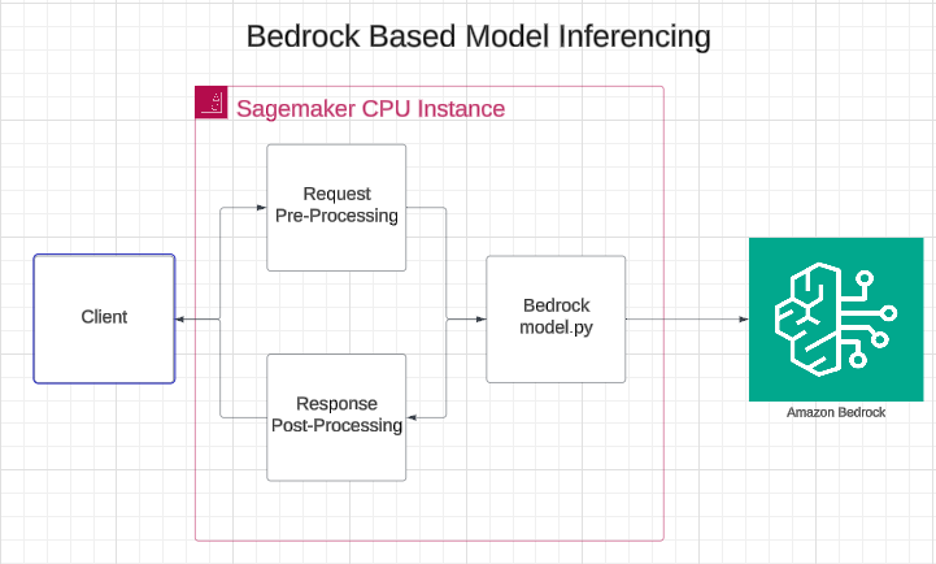
To address this gap, the engineering team developed an MCP (Model Context Protocol) server tailored for SDB performance analysis. The MCP server offers a standardized interface that enables engineers to use any MCP-compatible client, such as Cursor, to analyze database performance data. When engineers input performance data, the AI-powered tools can quickly identify inefficient joins, suggest missing indexes, and provide detailed explanations for why specific SQL statements are underperforming. This democratizes the expertise that was once confined to a small group of specialists, allowing a wider range of engineers to efficiently and effectively address database performance issues.
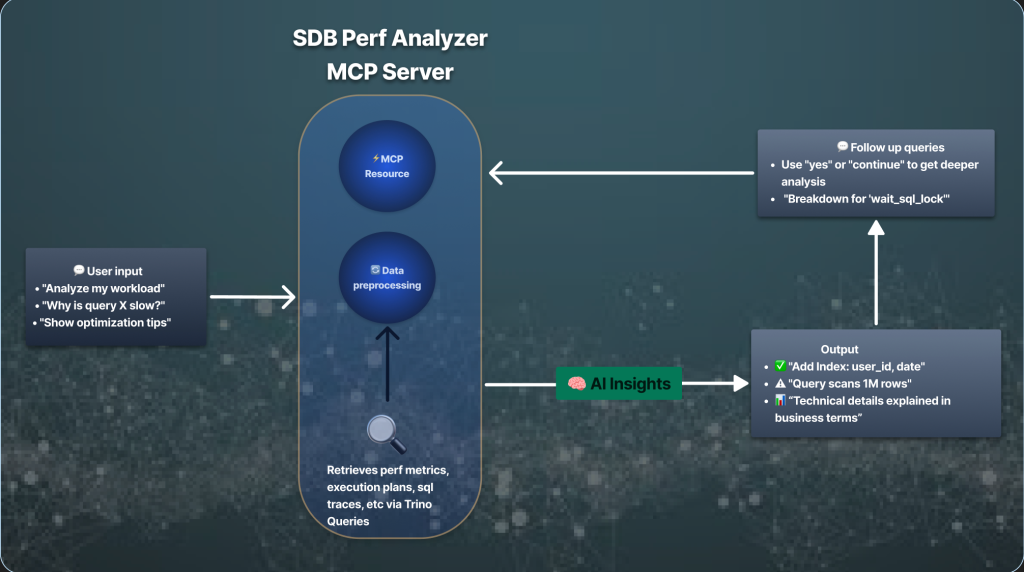
MCP Server mediating between user requests and database performance insights.
What workflow limitations with JMeter were hampering productivity — and how did AI enable an infrastructure cost reduction?
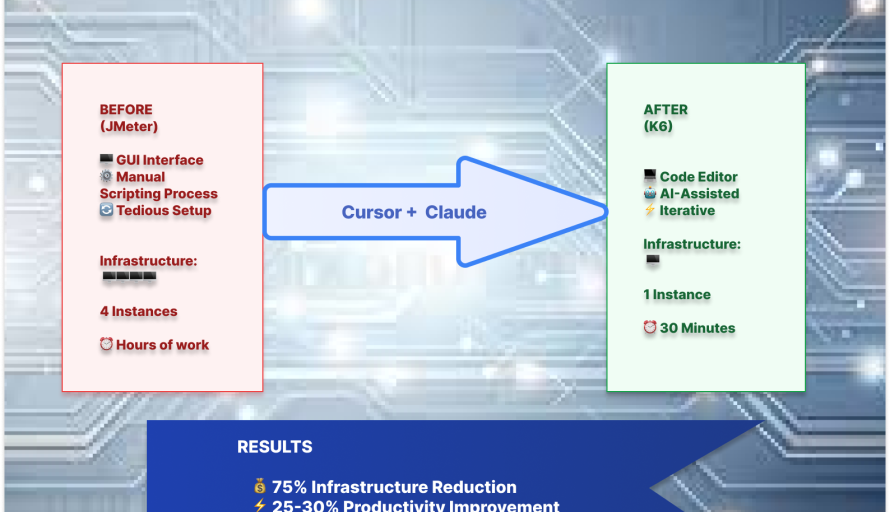
Traditional testing tools like JMeter imposed significant workflow limitations that slowed down development velocity and reduced infrastructure efficiency. As a Java-based GUI tool, JMeter required engineers to navigate through cumbersome window interfaces, making script development and testing a tedious and time-consuming process. More critically, JMeter’s memory constraints meant that increasing the load for comprehensive testing required spawning multiple compute instances — typically four instances to generate the necessary load.
These workflow constraints were particularly problematic because engineers couldn’t integrate modern development tools like Cursor into JMeter’s GUI environment. Script validation had to be done manually through the interface, rather than through automated testing workflows, which added extra friction to the development process.
The breakthrough came when the team leveraged AI through Cursor to completely migrate the testing infrastructure from JMeter to K6, a JavaScript-based scripting language that none of the engineering team members had prior experience with. The AI handled the complete K6 migration, guided by Cursor rules the team configured to maintain Salesforce compliance standards, eliminating the need for manual script development.
This automated testing migration resulted in a 75% reduction in load generator infrastructure requirements, decreasing the number of these compute instances needed from four to just one. The code-based approach allowed the engineering team to use Cursor for script development, creating an iterative testing workflow where AI could automatically identify issues, fix problems, and continue testing until the scripts were fully functional.
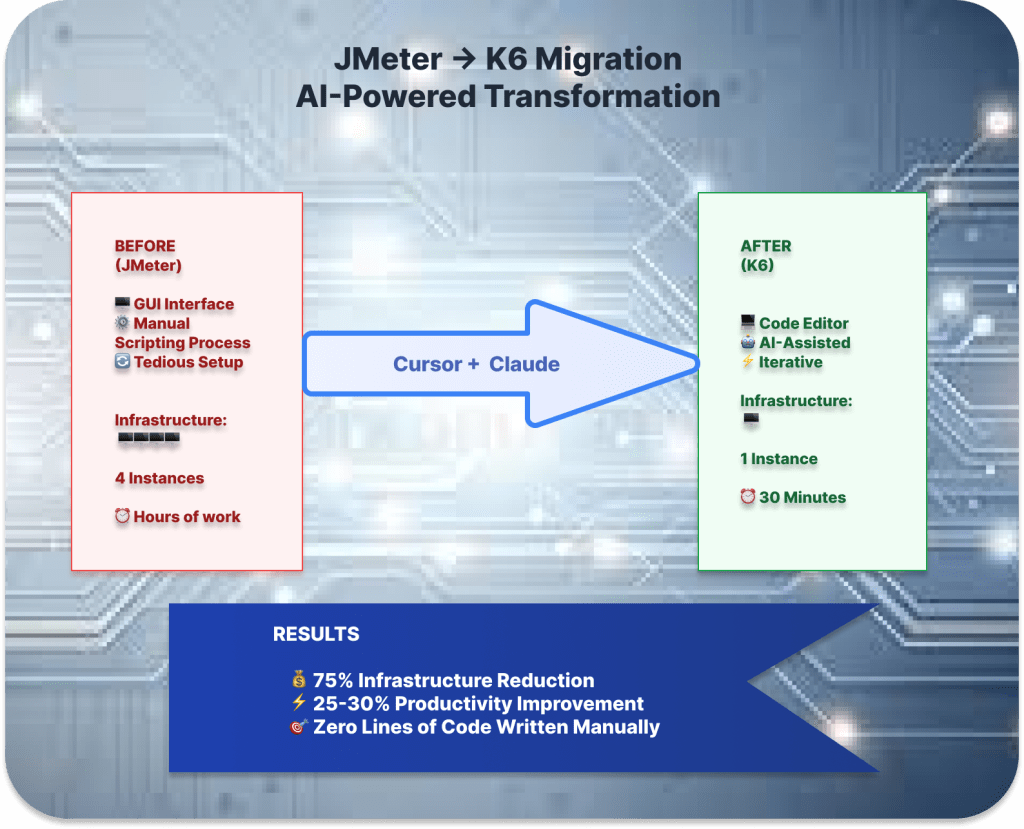
Transformation process from legacy JMeter to modern K6 framework cutting load generator infrastructure costs by 75%.
What capacity constraints were limiting the team’s project scope — and how has AI expanded capabilities?
Developer productivity challenges often arise from the time-intensive nature of manual coding, data analysis, and learning new frameworks. Traditional performance engineering approaches required significant time investments for tasks such as writing test scripts, analyzing performance data, and mastering new technologies, which limited engineering teams’ ability to take on innovative projects beyond their core responsibilities.
AI has dramatically expanded the engineering team’s scope, enabling them to tackle projects they wouldn’t have previously considered. The team now develops multiple MCP servers, including one for trace analysis that detects duplicate calls and another for SDB performance analysis. These tools represent entirely new capabilities that wouldn’t exist without AI assistance.
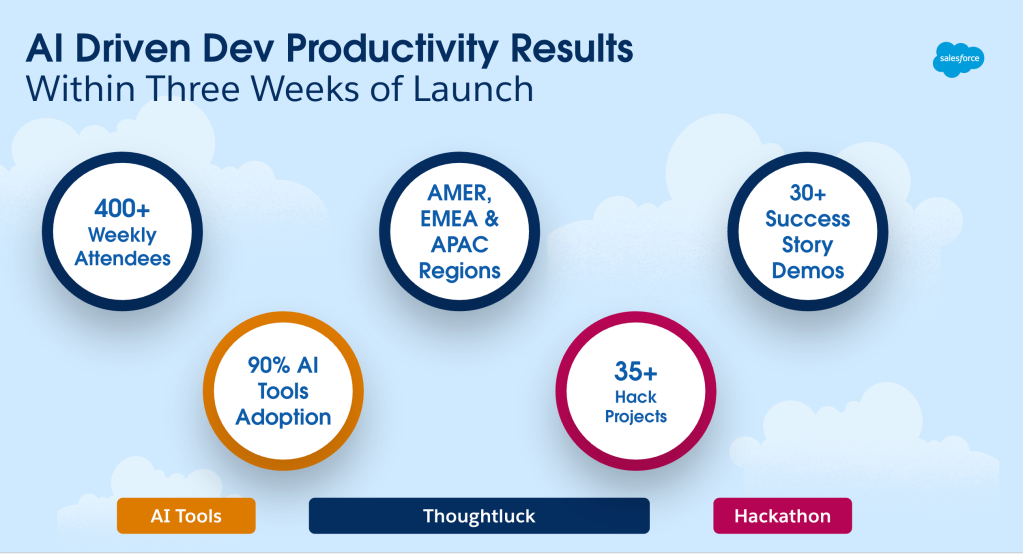
The measured gains in developer productivity highlight this transformation. For example, an ESP team member reported a 25-30% improvement in productivity for her existing work. More significantly, the team is now handling more varied categories of work since the AI adoption. Tasks that once required extensive manual effort are now completed much more quickly, freeing up engineers to focus on strategic initiatives like developing Performance Canvas, a platform that aggregates multiple AI tools and MCP servers to provide comprehensive performance analysis.
Rather than just working faster on existing tasks, AI has empowered the engineering team to become platform builders and tool creators, significantly expanding their impact within the organization and pushing the boundaries of traditional performance engineering.
Learn more
- Stay connected — join our Talent Community!
- Check out our Technology and Product teams to learn how you can get involved.