How can you make your services observable and embrace service ownership? This article presents a variety of universally applicable design patterns for the developer to consider.
Design patterns in software development are repeatable solutions and best practices for solving commonly occurring problems. Even in the case of service monitoring, design patterns, when used appropriately, can help teams embrace service ownership and troubleshoot their services in production. You can think of service monitoring design patterns in three categories:
- Health Checks
How do you know that your service is running — and, if it is — also doing what it’s supposed to be doing? Is it responding in a timely manner? Are there potential service issues that you can address before they affect customers? - Real time Alerting
When something does go wrong — such as your service becoming unresponsive, slowing to a crawl, or using too many resources — do you have alerts that you configured to notify you of that issue? - Troubleshooting
Has something gone wrong with your service? If it has, you probably need to know three things: when it happened, where it happened, and what caused it to happen. Use logs and traces to diagnose issues after they occur, and update your service so that those issues do not have lasting customer impacts.
Let’s look at the patterns (and a few anti-patterns!) for each of these categories in turn.
Health Checks
The two patterns for health checks are the outside-in health check, which verifies that your service is running and determines response time / latency from your service, and the inside-out health check, which keeps tabs on app and system metrics so that you can detect potential problems (including performance problems) before they cause an incident.
1. The Outside-In Health Check
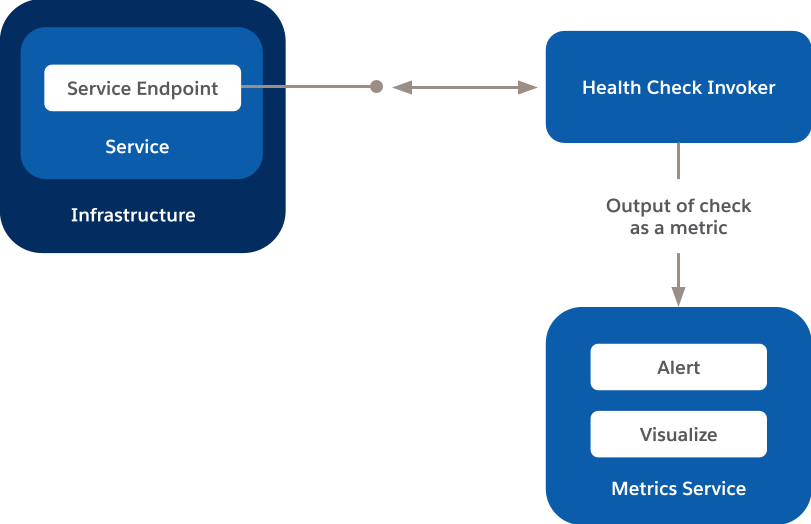
In this pattern, you ping your service endpoint using using a health-check service or a synthetic testing tool. We use a tool we built in-house, but other options include NewRelic, Gomez, and DataDog. Your service responds to the ping, which records the output of the check as a metric in a time-series metric system such as Argus or whatever you’re using for such a service. Once the data is available, you can visualize your service’s health and other key metrics over a period of time and/or opt for it to send you alerts when specific conditions are met.
The high-level pattern looks like this.

This pattern can be used to check two main groups of metrics:
- Uptime — This metric answers the time-honored question, “is my service running, and is it doing what it is supposed to do?” After the health-check invoker pings your service, if your service responds, it is up; if it doesn’t respond, it’s down, and you need to start remediation efforts
- User-perceived latency — You must check service latency from multiple locations around the globe. User-perceived latency might be different for a customer accessing your service from Japan, for example, than it is for customers accessing it from Spain and the United States. You can use the latency of the health-check API call as a proxy for user-perceived latency.
The combination of the two groups above can be used to determine a synthetic-based availability signal for your service as well.
2. The Inside-Out Health Check
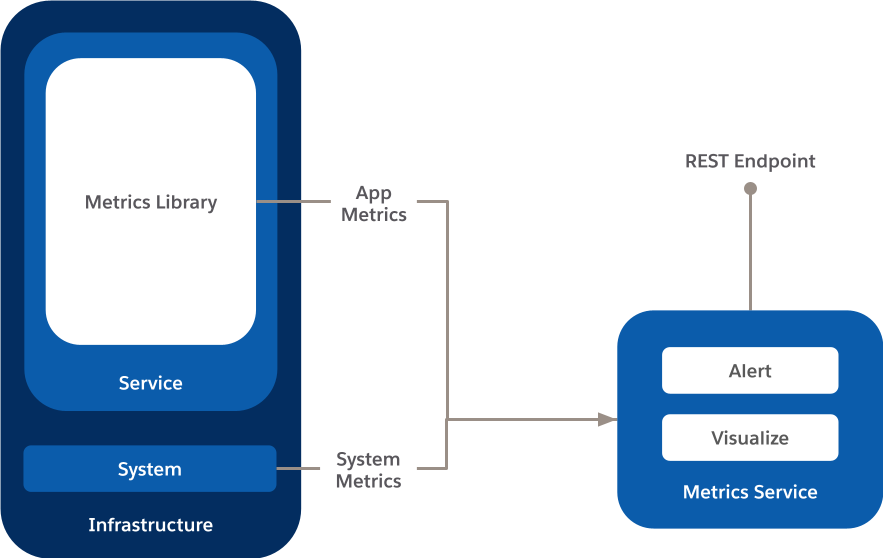
In this pattern, you use system and application metrics to detect potential issues before they result in service interruptions — for your service and your customers!
To determine whether there are underlying issues that might affect your service’s performance or availability, collect metrics on application and the underlying infrastructure on which it is running.

So which application metrics should you be concerned with? At a minimum, collect these four signals.
- Request rate — How busy is your service?
- Error rate — Are there any errors in your service? If there are, how many, and how often do they occur?
- Duration (of requests) — How long is it taking for your service to respond to requests?
- Saturation — How overloaded is your service? How much room does it have to grow?
In addition, gather these system metrics for each resource type (e.g. CPU, memory, disk space, IOPS) that your service uses.
- Utilization — How busy is this resource?
- Saturation — How utilized is the most constrained resource of the application which is impacting the application’s performance / ability to function normally?
- Errors — What is the resource’s count of errors?
Collecting these metrics allows you to also compute the availability metric of the service, which answers the critical question — Is my service or feature considered available to my customers? In most cases a combination of Uptime, Duration (latency) and Error Rate metrics can be used to compute the availability of the service in a manner that is representative of the customer’s experience with the service. E.g. if you compute the availability of the service solely based upon uptime, then you will still consider yourself available even if queries take a long time to respond / web pages take a long time to load. Hence, taking additional metrics such as Error Rates and Duration are critical for an appropriate definition of Availability.
An Anti-Pattern: Modeling Metrics Using Logs
Log data is great for troubleshooting, which we’ll talk about soon. However, given the volume of log data that most applications generate these days, you really don’t want to emit metrics using log data. Modeling metrics using log data is computationally expensive (which means expensive in monetary terms) and increases time to ingest, process and react which increases MTTD (mean time to detect). Neither of these outcomes are desirable. At Salesforce, we have teams that have built out efficient metrics-gathering tools for our developers to use.
Real time Alerting
Alerts and notifications are the primary ways in which you as a service owner would want to get notified when something is wrong with your service. You should configure alerts when key health and performance metrics of your service and infrastructure go above or below a specified threshold which would indicate an issue. E.g. when response time of the service suddenly increases beyond an acceptable threshold, when the availability of your service goes below the specified threshold such that it breaches the SLA of the service.
The goal of alerting is to notify a human or a remediation process to fix the issue and bring the service back to a healthy status so that it can continue to serve its customers. Although auto-remediation of an issue by kicking in an automated workflow upon getting alerted is desirable, not all issues (specially complex service issues) can be addressed as such. Typical scenarios where auto-remediation can be helpful include restarting the service to fix an issue, increase / decrease compute capacity in cloud environments, terminate an instance if there are any unauthorized ports open (security vulnerability).
By using more sophisticated techniques (including machine learning), you can make the experience better for the service owners by alerting proactively and detecting anomalies. Proactive alerting allows you to take the remedial action before the issue impacts service health and the customers. E.g. it is better to get alerted that based upon current usage trends you will run out of disk capacity in a week as opposed to getting alerted when you are 90% disk full! Proactive alerting provides for more lead time to fix the issue and the alert need not result in a page at 3am in the morning to fix the issue. It can be a ticket that can be logged for the service owner to look at the issue the following morning. Detecting anomalies reduces alert noise and saves service owners from configuring static thresholds on metrics to get alerted on. The system will alert you when it detects an anomaly in the pattern for a given metrics. It will take seasonality into account and thus will reduce false positive alerts (noise) and automatically adjust the thresholds over a period of time and its definition of what constitutes an anomaly.
3. Remediating Issues
The general pattern for alerting involves determining whether a problem can be auto-remediated, or whether some action needs to be taken by a human to avoid breaching your company’s Service Level Agreement (SLA) with your customers. This process flow diagram incorporates both auto-remediation and remediation requiring human intervention.

Alerting Anti-Patterns
- Don’t do glass watching. As systems scale and complexity increases, we cannot rely on humans to stare at monitors 24/7 to look for service health trends and call someone to fix an issue if the threshold is breached. We need to rely on machines and algorithms notifying us when something goes wrong. This also takes human errors out of the equation. Automate as much of the process as possible.
- All alerts are not created equal. As such, don’t treat all alerts the same way. Sending every small issue with the service as an alert to email/Slack channel results in nothing more than spam and greatly reduces the signal-to-noise ratio. For every service issue, that may potentially result in a customer issue / SLA breach (critical issue), page the on-call engineer (using something like PagerDuty). Everything else should be logged as a ticket (if action is needed) or should be logged as a log entry.
Troubleshooting
When something does go wrong with your service, you need information on what went wrong, when it went wrong, and where it went wrong. Code your service so that this kind of information is available to troubleshoot issues. There are two key ways to make that information available.
- Logging error conditions and related information
- Enabling distributed tracing in your service (especially in microservice environments)
4. Logging Error Conditions
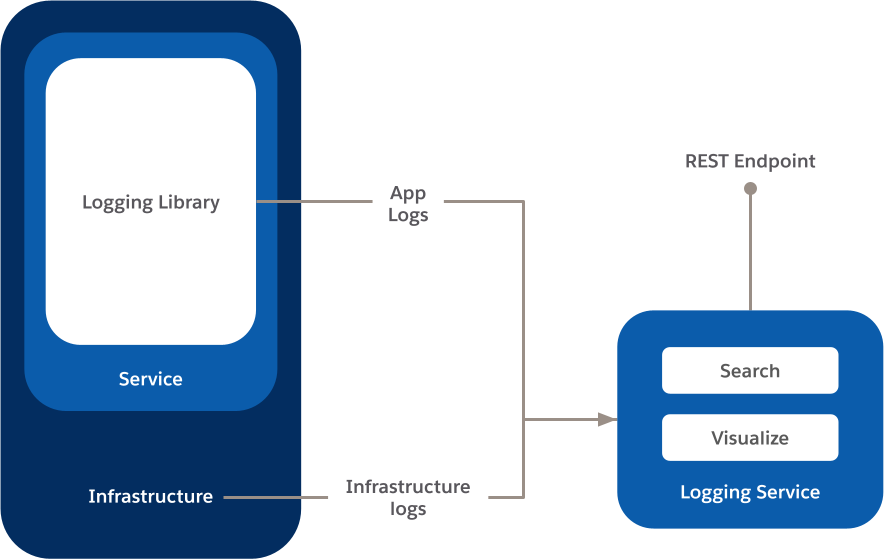
Logs are your best friends for finding out what went wrong with your service and when, so be sure to log your service’s error conditions. Include a logging library in your service to capture app logs and send those logs to a logging service. At Salesforce, we use Splunk, but some other options might be DataDog, NewRelic, etc.
When you troubleshoot, you can use both app and infrastructure logs to help you determine what caused an incident and how to reduce the chance of it recurring.
The following diagram captures the high-level architecture of a logging system.

5. Distributed Tracing for Microservices
In a microservices architecture, when an incident or performance degradation occurs, you need to know more than just what went wrong. You also need to know which of your microservices caused or contributed to the issue.
Distributed tracing allows you to get that info by identifying each request with a requestID. When an issue occurs, you can pinpoint where it occurred in the request stream and whether the issue was associated with your service or with a dependent service. At Salesforce, we’ve integrated all of our various applications with homegrown distributed tracing service (build on top of Zipkin), Tracer. Generated spans are sent to Tracer, and context is propagated to the downstream applications using B3 headers. For instrumentation, we use either Zipkin or OpenTelemetry libraries.
So now what?
By applying design patterns around health checks, alerting, and troubleshooting, you can build observable services from the ground up. There are many tools and additional resources out there to help you get started. One that we highly recommend is Google’s Site Reliability Engineering (SRE) book, particularly the “Monitoring” section in the Introduction and Chapter 6: Monitoring Distributed Systems. Also check out our Observability 101 series for even more on monitoring microservices.


