How to find out the root cause for a memory leak
edited by Dianne Siebold
Java memory troubleshooting is a well-discussed topic. You can find a lot of information about it in existing blog posts, so you may wonder: why write another one? Indeed, many blog posts introduce a variety of tools and techniques. But surprisingly, much of the information out there lacks depth, doesn’t provide a systematic view, and provides no methodology. This makes it difficult for developers to use this knowledge to solve a real-world problem.
This is the first post in two-part series about finding and fixing real-world memory issues in Java. This post introduces tools and methodologies for troubleshooting memory problems. In the next post, “Fix Memory Issues in Your Java Apps”, I cover how to fix the memory issues you find, and also how to handle troubleshooting in production.
In this blog post you’ll learn how to:
- Understand Java memory leaks
- Troubleshoot a memory leak
Understand Java Memory Leaks
What is a memory leak? A memory leak occurs when there are objects that aren’t being used by the application but can’t be removed from memory by the garbage collector. The garbage collector (GC) can’t remove referenced objects, so more memory resources continue to be consumed.
One of Java’s great advantages is its built-in garbage collection. When a Java program runs, objects get created in the heap. The garbage collector tracks every memory allocation in the heap and automatically deletes unused objects. Garbage collection works great, but it’s not foolproof. Memory can still leak despite having garbage collection.
Unlike in C++, memory leak problems in Java aren’t about losing track of memory allocation. Instead, Java memory leaks occur because objects that are no longer needed are unnecessarily referenced in the heap, which makes the garbage collector unable to remove them. Let’s look at some tools and techniques for finding a memory leak.
How to detect a memory leak
There are two ways to detect a memory leak. First, you can wait until your app crashes and you see an OutOfMemoryError exception in the log or console output. Second, which is what I always do, is to check the trending of the JVM’s old gen space size.
In the JVM heap, the old gen space is reserved for long-lived objects. The old gen space should be cleaned up after [major] garbage collection. So if you observe that the old gen space continues to grow after full garbage collection (check GC log), most likely your application has a memory leak. See this article on “understanding the Java memory model for details on the different heap spaces and different types of garbage collection.
You can enable the garbage collection log via a JVM setting and get the JVM memory usage from attaching a profiler or instrument the JVM metrics from your application directly.
Typical Causes for Memory Leaks
There are many possible causes for a memory leak. Here are the most typical ones. Check out the article Understanding Memory Leaks in Java for detailed explanations.
- Reference large objects with a long living object (usually static fields).
- Forget to close resources, for example to connections, streams, etc.
- Improper
equal()orhashCode()implementation for objects store in cache. - Forget to remove
ThreadLocalvariables. ClassLoaderMemory Leak (for example: JDK-6543126 : Level.known can leak memory).- Off-heap memory leak (native).
Troubleshoot Memory Issues
In this section, I’ll show you a few useful tools to collect essential data for troubleshooting, such as an application’s current JVM settings, a memory dump file (snapshot), and the JVM’s memory allocation in native space. I also present a generic troubleshooting strategy that can be applied on almost any memory issue.
For troubleshooting memory leaks in a heavily loaded production environment, I have some extra suggestions for you, please checkout my second blog post (“Fix Memory Issues in Your Java Apps” — “Troubleshoot in Production” section).
Assemble your troubleshooting toolbox
Here are some useful tools to troubleshoot JVM memory issues.
Get your Java application’s JVM settings
Before starting any investigation, the first thing I like to do is to check the current JVM settings of the application such as max and min heap size, metaspace size, and the garbage collection recycle time/ratio. These settings are critical for inspecting an application’s performance. You can get an application’s JVM settings by using the command-line tool jps, which lists all the instrumented Java Virtual Machines (JVMs) on the target system (see example below).
$ jps -v
44040 App -Xms2G -Xmx2G -XX:MetaspaceSize=1G -XX:MaxMetaspaceSize=1G -XX:NativeMemoryTracking=detail -javaagent:/Applications/IntelliJ IDEA.app/Contents/lib/idea_rt.jar=57671:/Applications/IntelliJ IDEA.app/Contents/bin -Dfile.encoding=UTF-8
Take heap snapshot
Use jmap, another tool by Oracle, to print out the heap memory details (also called a memory dump or snapshot) for a single process. Since this is also a command line tool you can run it on a remote server.
$ jmap -dump:file=example.hprof 49952      // you can get process id <ex:49952> from jps
Dumping heap to /Users/chi.wang/workspace/example.hprof ...
Heap dump file created
You can also use jmap to print out an object histogram for a single process. The histogram gives you a listing of how much memory is used by different types of objects. Compared to snapshot, it’s lighter weight and faster to collect but has fewer details. It’s useful when the process’s environment is short on memory.
Examine object allocations in the heap
A memory profiler is designed to get a view into the heap. According to A Guide to Java Profilers (Baeldung), “A Java Profiler is a tool that monitors Java bytecode constructs and operations at the JVM level. These code constructs and operations include object creation, iterative executions (including recursive calls), method executions, thread executions, and garbage collections.”
In practice, a profiler is the most frequently used tool when to troubleshoot Java memory issues. You can use a profiler to examine the JVM heap dump file or do live debugging by attaching the profiler to a process. It can make your life easier because it tracks details of the JVM (garbage collection, memory allocation, threads, CPU) and organizes the information in a nice UI. In this post, I use the Yourkit profiler, but the skills introduced here apply to any profiler.
Check JVM native memory usage
Besides the heap, the JVM also occupies native memory for threads stack, code, symbol, etc. When the heap looks fine, it’s time to check the JVM’s native memory usage: metaspace, thread stack size, etc.
Native Memory Tracking(NMT) is the tool to examine how the JVM performs in the native memory space. NMT is easy to use. You just need to add the flag XX:NativeMemoryTrackingin the JVM settings, and then use jcmdto check the results.
// enable NMT
-XX:NativeMemoryTracking=summary or -XX:NativeMemoryTracking=detail.// set baseline and check diff
jcmd <pid> VM.native_memory baseline
jcmd <pid> VM.native_memory detail.diff / summary.diffjcmd <pid> VM.native_memory summary
Keep in mind that NMT doesn’t track third-party native code and JDK class libraries. This could be confusing, since from its name, you might think it tracks every native memory allocation for the application. For example, if your application uses the Tensorflow JNI library, it will consume a lot native memory when loading models for graph and session, but all these objects aren’t tracked by NMT. The section “Detect and Solve a Native Memory Leak” in my second post “Fix Memory Issues in Your Java Apps” discusses how to solve this type of problem.
Use the recommended JVM settings for troubleshooting
Here are some suggested JVM settings to help you troubleshoot. You can use the jps tool to check your application JVM setting (see the “Get your Java application’s JVM settings” section in above). Enabling the garbage collection log is critical because the application’s memory status after each garbage collection activity could indicate whether there’s a memory leak.
// jvm space size settings
-Xms -Xmx     // min and max heap size
-XX:MetaspaceSize -XX:MaxMetaspaceSize    // min and max metaspace
-XX:NativeMemoryTracking=detail      // enable native memory tracking
-XX:MaxDirectMemorySize      // limit direct memory allocation // enable gc log
-XX:+PrintGCDetails -XX:+PrintGCDateStamps -XX:+PrintHeapAtGC
-Xloggc:logs/gc.log -XX:+UseGCLogFileRotation -XX:NumberOfGCLogFiles=1
-XX:GCLogFileSize=1M // enable OOM dump
-XX:+HeapDumpOnOutOfMemoryError -XX:HeapDumpPath={any_path}/heap_dump.hprof
General Steps to Troubleshoot a Memory Leak
After you get familiar with the tools and JVM settings, use the following steps to troubleshoot your application.
1. Get familiar with application code and user scenarios.
To correlate symptoms uncovered by a profiler to the root cause in code, you need to be familiar with the application code. I usually read the code to trace through the major workflow before I use a profiler. This way, I’m aware of where the large objects or data batch objects are created and referenced in memory.
2. Prepare measurements for JVM’s young/old gen space consumption.
You could either instrument the JVM metrics from code or attach a profiler to your application. (More details of JVM Heap in this article: Understanding Java Memory Model).
3. Take a heap snapshot (dump) before the test.
Use the jmap command to create snapshot file (Take heap snapshot) before debugging.
4. Perform some resource heavy operations on your app.
Exercise your application with some heavy load scenarios. For example, upload 10 datasets (20GB each).
5. Check the application’s JVM memory graph after full garbage collection.
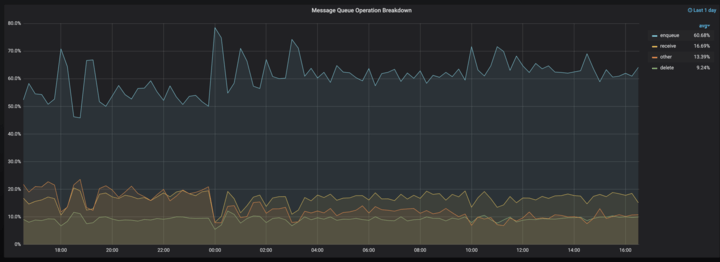
If you observe the old gen space continue grow after several full garbage collections, then it’s a clear sign of a memory leak. In the graph below, the blue color represents the young gen space and the orange color is the old gen space. You can find that objects are moved from young gen (blue) to old gen (orange) after every full garbage collection and never get released, which is clear sign of a memory leak.

Most Java profilers, like Yourkit, provide a “force garbagec collection” feature, which is very handy for you to trigger a full garbage collection while the application is running. If attaching a profiler to your application isn’t an option, you can check the garbage collection log to find out when full garbage collection happens, and then check your application’s JVM metrics to get the young/old gen usage at the time.
6. Take second heap snapshot and start to analyze.
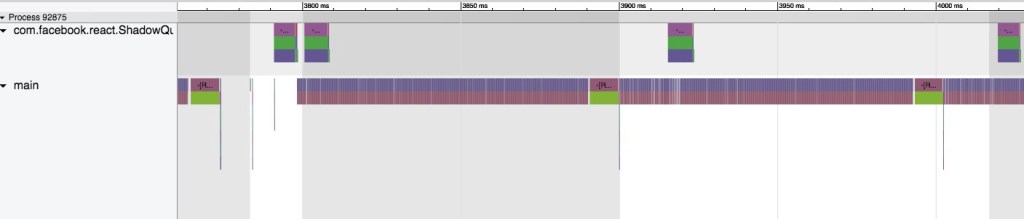
Take a second heap snapshot and exam with profiler to find the most increased objects which still are referenced after full garbage collection. You could start from profiler’s “Generation View” or “Reachability View” (see example below). If it’s not clear, compare the second heap snapshot with first one you took in step 3.

7. Find suspect objects in code.
Check the incoming references for each big object in profiler and do a code analysis to find out these references in your code base, most likely they are the root cause.
In the below profiler screenshot, from the Object explorer window, we see that the majority of the String objects are referenced by a Java arrayList, which takes up 36 MB memory. This indicates a potential leak which we should check in the source code.

8. Break the reference and verify
Break the reference of suspected objects in code and repeat steps 3–7 to verify the application’s memory graph get flattened. If so, it proves that you have found the root cause. Usually the fix is straightforward, for more complicate cases which need code refactoring, please check out the section “Mitigate Memory Pressure” in my second post “Fix Memory Issues in Your Java Apps”.
Last but not the least, I want to call out the “profiler worship” thinking. A profiler is a great helper, but it’s not everything. The main reason to use a profiler is to expose the JVM internals in an organized way. A basic (free) profiler is good enough in most cases. The real challenge in memory troubleshooting is how to find the application code that’s causing the problems that the profiler exposes. The only way to solve this problem is to understand your application codebase and have a good understanding of the Java language.
Now that you’re familiar with the troubleshooting tools and have a general troubleshooting methodology, finding the root causes of a memory leak should feel less intimidating. But how do you fix the application once you find out the root causes? In the next and final blog post in this series, “Fix Memory Issues in Your Java Apps”, I’ll talk about how to do just that.