
Kunal Nawale is a Software Architect at Salesforce who designs, architects, and builds Big Data Systems. Kunal did the design and architecture of this project. Kyle Lau and Xuyu Fu did the implementation and testing.
In monitoring systems, tags or dimensions add significant value in analyzing time series data. Various slicing and dicing, aggregations and rollups can be done on this data. This provides tremendous insights into your infrastructure and application. As your business grows, the number of devices in your infrastructure grows, number of services grow and with it grows the cardinality of the tags. Supporting high cardinality becomes a critical need. However, supporting high cardinality in time series is no easy feat. And on top of that providing wildcard searching, even more difficult and expensive. This article shows how we solved this challenge at Salesforce for our ever growing time series platform.
What Is Time Series Cardinality ?
Let’s assume you have a metric named request.latency and each device in your infrastructure reports this metric. Your timeseries ID will look like this:
request.latency{device=h1.com}
If you have 1000 such devices then there are 1000 unique time-series. Now you decided to add OrganizationId to track each of your customer’s request latency. The time-series ID will look like this:
request.latency{device=h1.com, OrganizationId=org1}
Adding geographic redundancy to your application becomes a requirement. So you spin up another datacenter with the same number of devices as your primary datacenter. Your time-series ID now looks like this:
request.latency{device=h1.com, OrganizationId=org1, datacenter=ew}
Along with request.latency, there are 5 other metrics that you want to track per organization. The cardinality count equation is:
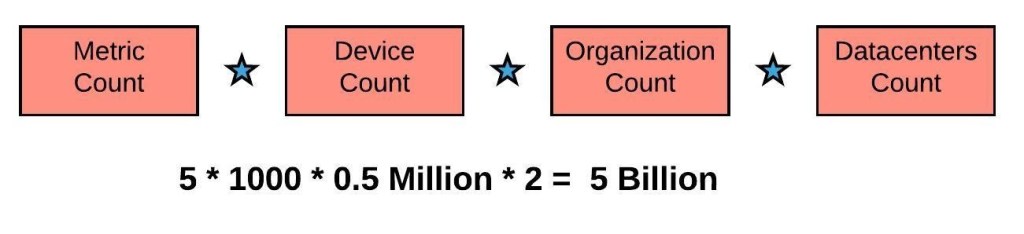
As you can see, by just adding a few dimensions, the cardinality count explodes. Each of these unique time-series occupies a distinct row in the time-series backend. Supporting so many rows and doing a quick search and retrieve on that data becomes an expensive compute operation. This is also the reason why Amazon Cloudwatch charges $0.02 per timeseries. The cost of supporting this cardinality time-series on AWS would be $20 Million !
Salesforce Time Series Platform
At Salesforce we developed an in-house metrics platform, Argus, which we have open sourced. We use Elasticsearch for storing the tags and leverage its fantastic free text search capabilities to provide an easy and rich metric discovery experience. In this past blog, we shared how we enhanced the metrics discovery feature and made it fast and scalable. We increased our scale by leveraging various features like bloom filters and different indices for different document types. The tags are stored in a single index with the following schema:
{
   scope:    <value>,
   metric:   <value>,
   tagkey:   <value>,
   tagvalue: <value>
}
As our tag volume grew we soon reached the limits of the scale enhancements we outlined in the past blog. As soon as the tags index reached 1.7 billion documents, queries became slower. We had a nightly purge job to delete unused tags. This job started taking hours to complete, further increasing the query response times. We realized we needed a better way to handle this growth.
Split And Conquer
After analyzing our data, we saw that we had 500+ services sending their own unique tags. Each of these services had their own requirements; some needed high cardinality but low retention, some had low cardinality but needed high retention. The single tags index we had could not provide an optimal solution to each of these distinct requirements. It was time to split this single tags index into multiple indices. Tags for each service went into their own unique index. We created 50 such indices based on volume and the rest of the services went into a catch-all index. By doing this each service is now able to grow to 1 billion tags without increasing query latency. Our total tags capacity grew from 1.7 billion to 50+ billion !
Growth is now a pure function of how many nodes we want to add to our Elasticsearch cluster. We separated 50 services, but all 500+ services can go into their own index by adding more nodes, and we can easily support 500+ billion tags.
Migration
Migrating the single index into 50 indices on a production system was quite challenging. We had to make sure there was no customer impact. The entire Salesforce infrastructure and many individual applications rely on Argus for serving their monitoring needs. We needed to maintain that trust. So, how did we do this?
We relied on creating a robust test plan and iterated on it several times in a dev env. We also leaned heavily on the alias and slicing feature supported by Elasticsearch.
Here is a snapshot of the approach we took.

The migration went really smoothly with no customer impact.
After switching to service-specific indices, not only did our scale grow but also the query latencies improved by 15%, in spite of the query volume growing by 5x.
Summary
Solving big data problems is quite challenging and novel in many cases. A few things we learned:
- Understand your data and usage pattern. Squint hard at this and it will give you ideas on solving problems. Splitting the index based on service names and usage patterns is something we gleaned by following this principal
- Leverage open source: Elasticsearch has some powerful features; horizontal sharding, query-splicing, index aliases proved out to be very powerful tools for us.
- Plan for 10x of your current needs: In the Big Data world, the size of your data grows very fast. After doing the above changes we have capacity to support 25x of our current needs.
If working on big data scale and solving tough problems is your thing, then reach out to us at our careers page.