
Performing OLAP (Online Analytical Processing) data analysis over an ever-growing data set might not seem as challenging as launching a rocket nowadays, but delivering high-quality insights at a large scale is never a trivial job. As the Edge Intelligence team in Salesforce, our goals are to:
- Ingest billions to trillions of log lines per day.
- Allow users to define a combination of dimensions and filters on dimensions and different types of aggregation on metrics.
- Return query results of real-time data interactively within seconds.
A decision we need to make here is whether to store pre-aggregated data or raw data. For example, we need to ingest 5 billion events into our system every day; if we have to store every single one of them in our system and perform aggregations at query time, the chance that our queries return results in sub-seconds is very slim. But if we can store aggregated data, the storage footprint and query performance would be improved significantly. However, the drawback is obvious: if data is pre-aggregated, we lose the ability to query raw data, which is, luckily, acceptable in our use-case.
We (Edge Intelligence) chose Apache Druid as our real-time analytical database to store application performance metrics extracted from log lines. Our customers within Salesforce, including engineers, product owners, customer service representatives, etc., use our service to define the way they want to ingest and query their data and obtain insights such as performance analysis, trend analysis, release comparison, issue triage, and troubleshooting. We chose Druid because it gives us the flexibility to define pre-aggregations, the ability to easily manage ingestion tasks, the ability to query data effectively, and the means to create a highly scalable architecture.
In this blog post, we’ll cover some basic concepts of Apache Druid and how we optimize Druid segments to reduce storage costs and improve query performance, which gives our users an interactive and smooth experience to obtain insights.
A simplified overview of our system can be found below. The contents discussed below are all based on Druid ingesting real-time traffic from Kafka.

Druid Data Modeling and Architecture
The fundamental data modeling concept in Druid includes Dimensions and Metrics, which is not the primary topic of this post. Let’s look at some of the modeling concepts in Druid:
- Columns=Dimensions+Metrics
- Dimensions are filterable and group-able, which normally represents the scope of slice and dice in your query
- Metrics are measurements of users’ interests, which usually correspond to the column where users apply aggregations at query time, such as
max(),sum(),distinct_count(),95thPercentile().(It is worth noting that aggregations in Druid can be applied both at ingestion time and query/post-query time.)
Druid assumes every datasource has a primary timestamp (which is a special dimension) so that it can treat a datasource as an infinite time-series data stream and then partition/shard the infinite stream into a series of sequentially discrete time-trunks based on timestamp. The original problem of processing an infinite stream now becomes how to index and read each time-trunk; in our case, data from Kafka would be indexed into Druid segments.
Druid has two types of data nodes: Middle Manager node and Historical node. The former is responsible for receiving, parsing, and indexing incoming data of the current time-trunk. I call it “hot” data because the current time-trunk is not yet finalized; it is volatile, as it changes quickly and can be dropped, lost, and re-ingested again in case of any ingestion failures. Once “hot” data is finalized, it is handed off to deep storage (“hot” becomes “cold” as it is finalized). Then Historical node becomes responsible for serving the data to queries from broker nodes. I created a hybrid view below to better illustrate these ideas.

It is worth noting that Middle Manager has a dual purpose: it performs indexing and pre-aggregation of the current time trunk, and it also serves queries that contain the range of the current time-trunk. Because the latest data is not “hand-off” yet and always only available in Middle Manager. Meanwhile, historical nodes maintain a local instance-level cache of data segments from DeepStorage(such as Google GCS, AWS S3, Microsoft Azure Storage). Many OLAP databases (such as Presto and Snowflake) employ similar strategies to bring data to compute from external storage.
As shown above, the broker would fan out the query request to multiple data nodes and merge them before returning the result. Because data is consistently hashed across data nodes, the Druid broker is aware of the location of target segments by looking at interval in the query request. If interval includes the current time-trunk, Middle Manager would be part of data nodes that serve this query. That’s how you query real-time data from Druid.
What are rollup ratios and why do they matter?
Like most OLAP databases, cardinalities of data play a vital role in storage footprint and query performance. Timestamp is the first challenge to bring down the overall cardinalities. You can think of it as a special dimension that has close to infinite cardinality, grows continually, and is always different in each time-trunk. Thus, it is worth it to put extra effort into reducing the cardinalities introduced by timestamp. The way Druid approaches this is called rollup; you can think of rollup in Druid as a scheme to generate a summary of data by truncating the timestamp and pre-aggregating. Truncating the timestamp is an effective way to reduce cardinalities that are introduced by timestamp. Druid generates mergeable aggregates after rollup in segments and records them with the same combination of dimensions (including the truncated timestamp). Druid can easily calculate aggregates from billions of records in sub-seconds.
Then why do rollup ratios impact performance?
In theory, rollup ratio plays an important role in Druid because higher rollup ratios mean fewer rows stored in Druid, which means less data to store and query. Thus, improving rollup ratios for your datasource is like a “weight loss” effect that would lead to the performance gain. We use it to measure the effectiveness of our segment optimizations.
When we discuss rollup ratios, new data is not necessarily “new” from the perspective of rollup ratios, what impacts the rollup ratios are new combinations of dimensions. If the new data contains the same set of combinations of dimensions as the existing data in the segment, it would be merged into the existing summary of data and stored in the same row in Druid.
Segment Compactions
A typical problem we see when ingesting data from streaming data sources such as Kafka or Kinesis to Druid is that the rollup ratios are relatively low in high cardinality data streams compared to ingesting from static data sources, because the streaming-based indexer (Kafka or Kinesis Indexer) in Druid performs rollup only at best-effort. A few factors lead to this outcome:
- Parallel ingestion in streaming-based indexer creates sub-optimal rollups.
- The streaming-based indexer is always processing data that is not finalized. Since Druid cannot see the future of data in current interval, Druid cannot guarantee the rollup is perfect in streaming scenario.
- Interim hand-off in streaming-based indexer does not wait for the data of the whole time-trunk to accumulate and perform aggregations on top of it; instead, it accumulates a part of the data and incrementally publishes them as segments, which leaves room to optimize after handoff.
Those factors lead to low rollup ratios and a large number of small(MBs instead of hundreds of MBs) segment files for the streaming-based indexer, which is a penalty at query time. In fact, too many small segments would lead to unnecessary context-switching and sub-optimal parallelism when loading segments. On the other hand, too few segments would result in reduced parallelism which again harms the query performance. The ideal size of a segment would be about 5 million rows or around 300Mb to 700Mb of data.
As you can see, the goal here is to reach a balance so that a segment would have an ideal size that is efficient both for storage and query. Since, for streaming-based ingestion, the rollup ratio is usually low because of the factors mentioned above, a very effective way to improve the roll up ratio is through compaction.
But why would compaction improve rollup ratio?
Think of data in two segments of the same time-trunk like below. Assuming segmentGranularity is 1 HOUR, which means the width of time-trunk is one hour, each time-trunk contains multiple segments in the same HOUR, and queryGranularity is 1 minute, so the timestamp of raw data is truncated at the MINUTE level. For example we have two segments that belong to the same time-trunk below:
Segment A:
       Timestamp         |ProductName | Country | Count
2020-08-18T01:01:00Z     |  apple     |   US    |  1
2020-08-18T01:02:00Z     |   pear     |   CAN   |  10
Segment B:
       Timestamp         |ProductName | Country | Count
2020-08-18T01:01:00Z     |  apple     |   US    |  2
2020-08-18T01:09:00Z     |  banana    |   CAN   |  301
We notice that, in these two segments, the first row (“apple”) contains exactly the same set of dimensions, which means if we merge these two segments into one, the row containing “apple” will be in one row instead of two, so the compacted segment would looks like this :
       Timestamp         |ProductName | Country | Count
2020-08-18T01:01:00Z     |  apple     |   US    |  3
2020-08-18T01:02:00Z     |   pear     |   CAN   |  10
2020-08-18T01:09:00Z     |  banana    |   CAN   |  301
When data volume is large with moderate cardinality, and we have a large number of segments, there’s a good chance that we can find identical sets of dimensions in multiple segments, thus compacting them together will increase the overall rollup ratios, and leads to reduced storage footprint and better performance.
Real-life Example
Here is an example from our production environment. We pick a data source at time-trunk at 2020-08-18 00:00:00.000 . Before compaction, note that the rollup ratio is 115 and the number of rows is about 2.3 Million:

You can also query the sys table to perform some analysis about segments:
SELECT
"datasource","start" AS "Segment Time", COUNT(*) AS "Number of Segments",
SUM("size")/1024/1024/1024*1.0 AS "Total Size(GB)",
AVG("size")/1024/1024*1.0 AS "Avg Size Per Segment(MB)",
AVG("num_rows")/1000 AS "Average Num of Rows Per Segment(k)"
FROM sys.segments
WHERE "datasource" = '--data source name--' and "start"='2020-08-18T00:00:00.000Z'
GROUP BY 1,2
ORDER BY 2,5 DESC
We can find below that we have a total of 2504 segments for that time-trunk, and each segment has only 64Mb of data per segment, which indicates that there is room to improve.

Now we want to try compaction and hope it improves our rollup ratios and reduces the number of rows stored in Druid. You can submit a compaction task through your admin console:
{
  "type": "compact",
  "dataSource": "--data source name--",
  "interval": "2020-08-18T00:00:00.000/2020-08-19T00:00:00.000",
  "tuningConfig" : {
    "type" : "index",
    "maxRowsPerSegment" : 1500000,
    "maxRowsInMemory" : 500000
  },
  "context" : {
  "priority" : 100,
  "forceTimeChunkLock": true
}
}
Please note maxRowsPerSegment does not always have to be 5 million. In our case, each row of data is big. As such, 5 million rows for one single segment results in few gigabytes of data, which is not ideal for parallelism.
After compaction:


And a summary of improvement after compaction:

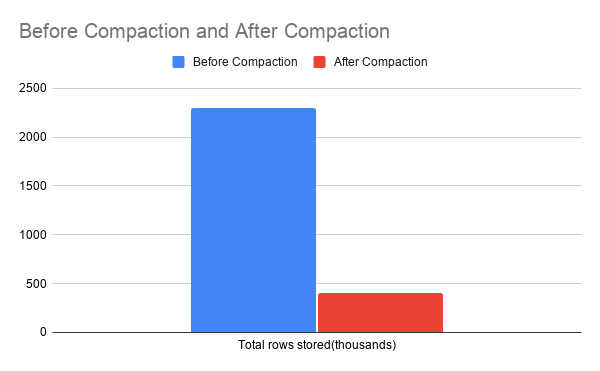


For one day of data, we end up saving 82% in the total number of rows stored in Druid, which translated to 47% total savings in the storage footprint and about 30% improvement in query time performance. The effectiveness of compaction depends on the cardinality of your data. If your data has infinite cardinalities, enabling rollup will not provide any benefit at all and you are effectively storing raw data instead of aggregated data. In this scenario compaction would not provide any gains, either.
Auto-Compaction
Druid provides an easy way to perform auto-compaction for your datasource. Basically, the user defines some rules for Druid to search for segments to periodically perform compaction on. You can schedule auto-compaction easily through the Druid admin console, and I do recommend enabling auto-compaction on all the datasources that use streaming-based ingestion. Here’s an example we are using right now in production:

Conclusion
Of course, there are a lot more challenges besides the ones I’ve mentioned in this blog post, such as operating Spark applications in Kubernetes at large scale, maintaining high availability of our services, data visualizations on top of Druid, etc. Stay tuned as we will share more experiences along our journey of delivering high-quality insights to more customers within Salesforce!